
Bollinger Bands are a popular technical analysis tool widely used by traders to analyze price volatility and identify potential trading opportunities. Created by John Bollinger, this indicator consists of three lines plotted on a price chart, which dynamically adjust based on market conditions. In this article, we will explore the Bollinger Bands strategy, understand how it works, and discuss various ways to effectively utilize it in trading.
How Bollinger Bands Work
Bollinger Bands are calculated using a simple moving average (SMA) as the middle band and two standard deviations as the upper and lower bands. The distance between the bands represents the volatility of the price. When the volatility is high, the bands expand, and when it is low, the bands contract. This dynamic nature makes Bollinger Bands a powerful tool for traders.
Using Bollinger Bands for Entry and Exit Points: One of the primary uses of Bollinger Bands is to identify overbought and oversold conditions in the market. When the price touches or crosses the upper band, it indicates overbought conditions, suggesting a potential reversal or pullback. Conversely, when the price touches or crosses the lower band, it indicates oversold conditions, signaling a potential upward price movement.
Bollinger Bands can also be used to spot trend reversals. When the price consistently touches or breaks through the outer bands, it may indicate a trend change. Traders often wait for confirmation signals, such as candlestick patterns or other indicators, before taking action based on these reversals.
Bollinger Bands are helpful in analyzing volatility. When the bands are narrow, it suggests low volatility, and when they are wide, it indicates high volatility. Traders can take advantage of periods of low volatility by anticipating potential breakouts or preparing for an increase in volatility.
Strategies
There are several popular strategies that traders employ using Bollinger Bands. One such strategy is the Bollinger Squeeze, which occurs when the bands contract to their narrowest point. This indicates a period of low volatility and is often followed by a significant price move. Traders can prepare for this move by setting entry orders on both sides of the price and wait for the breakout.
Another strategy is the Bollinger Bands breakout. When the price breaks above the upper band or below the lower band, it suggests a potential continuation of the trend. Traders can enter a position in the direction of the breakout and set stop-loss orders to manage risk.
Additionally, Bollinger Bands can be utilized for reversal trading. When the price reaches the outer bands and shows signs of exhaustion, such as divergence with other indicators or candlestick patterns, traders can anticipate a reversal and take a counter-trend position.
Tips for Successful Bollinger Bands Trading
To effectively use Bollinger Bands in trading, it is crucial to set the right parameters based on the market and timeframe being analyzed. Different securities and timeframes may require adjustments to achieve optimal results. Experimentation and backtesting can help in finding the parameters that work best for a specific trading strategy.
It is also important to consider other indicators for confirmation. Bollinger Bands work well when combined with other technical analysis tools such as oscillators, trend lines, or volume indicators. The convergence of multiple signals can increase the probability of successful trades.
Managing risk is essential in any trading strategy, and Bollinger Bands can assist in this aspect. By setting stop-loss orders below the lower band for long positions and above the upper band for short positions, traders can limit potential losses if the market moves against their position.
Case Studies and Examples
To better understand the practical application of Bollinger Bands, let’s consider a few case studies. In a recent uptrend, the price of a stock consistently touched or crossed the upper Bollinger Band. Traders using Bollinger Bands as an overbought signal could have taken profits or initiated short positions, anticipating a pullback. Analyzing such instances can provide valuable insights into the effectiveness of Bollinger Bands in real-life trading scenarios.
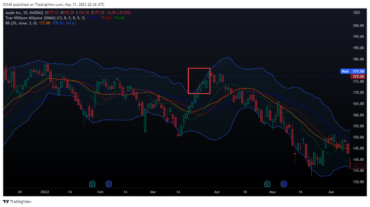
In March 2022, AAPL stock was in an uptrend, steadily climbing in price. Traders using Bollinger Bands would have noticed that the price consistently touched or crossed the upper Bollinger Band. This indicated potential overbought conditions and a possibility of a pullback or trend reversal.
As the price continued to rise and touch the upper band, traders using Bollinger Bands as an overbought signal could have taken profits or initiated short positions, anticipating a correction or pullback in the stock’s price. This approach would have allowed them to capitalize on the temporary price weakness.
In this case, let’s say a trader identified an overbought signal when AAPL stock touched the upper band on March 25th, 2022 at $170 a share. They decided to take profits on their existing long position and wait for a potential pullback to re-enter the market.
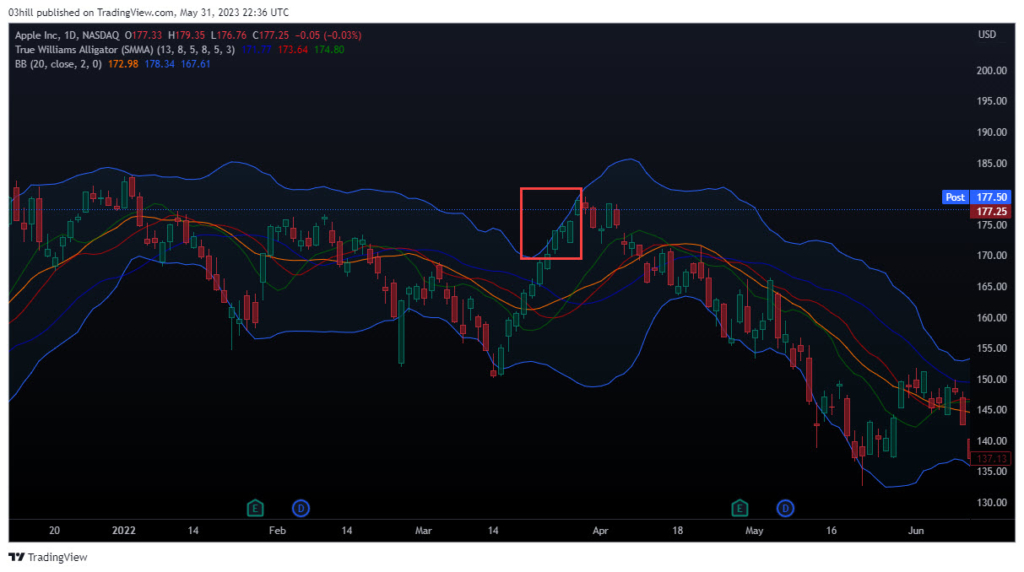
Over the next few trading sessions, AAPL stock indeed experienced a major pullback, lasting 2 months, confirming the effectiveness of using Bollinger Bands as an overbought signal. Traders who employed this strategy could have re-entered the market at a more favorable price, around $140 a share at the time, thereby maximizing their potential gains.
This example showcases how Bollinger Bands can be used to identify overbought conditions and assist in making timely trading decisions based on price volatility and potential trend reversals.
Common Mistakes to Avoid
While Bollinger Bands can be a powerful tool, traders should be cautious of common mistakes. Chasing the bands, i.e., entering trades solely based on the price touching the bands, without considering other factors, can lead to false signals and poor trading outcomes. It is important to analyze the overall market trend and take into account other relevant factors to increase the accuracy of trading decisions.
Bollinger Bands strategy is a valuable tool for traders to analyze price volatility, identify potential trading opportunities, and manage risk effectively. By understanding the calculations and interpreting the bands’ behavior, traders can make informed decisions and increase the likelihood of successful trades. However, like any trading strategy, it is important to combine Bollinger Bands with other indicators, adapt to changing market conditions, and manage risk prudently.
FAQs:
- What are the optimal parameters for Bollinger Bands?
- The optimal parameters for Bollinger Bands depend on the market and timeframe being analyzed. It is recommended to experiment and backtest different parameters to find the ones that work best for a specific trading strategy.
- Can Bollinger Bands be used in conjunction with other indicators?
- Yes, Bollinger Bands can be used in conjunction with other indicators such as oscillators, trend lines, or volume indicators. Combining multiple indicators can provide confirmation and increase the accuracy of trading signals.
- How do Bollinger Bands help in identifying trend reversals?
- Bollinger Bands help in identifying trend reversals by signaling when the price consistently touches or breaks through the outer bands. Traders often wait for confirmation signals, such as candlestick patterns or divergence with other indicators, before considering a trend reversal.
- What is the significance of the Bollinger Squeeze strategy?
- The Bollinger Squeeze strategy indicates a period of low volatility when the bands contract to their narrowest point. It suggests a potential