
In this article, we will explore the best moving averages for day trading and how they can enhance your trading strategy. In the dynamic world of day trading, finding the right indicators to make informed decisions is crucial. One such tool that traders often rely on is moving averages. Moving averages are mathematical calculations that help smooth out price data over a specific period, providing valuable insights into market trends.
Table of contents
- Simple Moving Average (SMA)
- Exponential Moving Average (EMA)
- Moving Average Crossover Strategy
- Length of Moving Averages
- Moving Averages and Trend Identification
- Best moving averages for day trading: Practical Application
- Case Scenario:
- Other Types of Moving Averages
- Tips for Effective Use of Moving Averages
Simple Moving Average (SMA)
The simple moving average (SMA) is the most basic form of a moving average. It calculates the average price over a specified number of periods and plots it on the chart. Traders often use SMAs to identify the overall trend direction and potential support and resistance levels. The simplicity of SMA makes it easy to understand and widely used among traders.
Calculating the SMA involves summing up the closing prices of a security over a defined period and dividing it by the number of periods. For example, a 50-day SMA would sum up the closing prices of the last 50 days and divide it by 50.
While SMAs are popular, they have limitations. Since they give equal weight to all data points, including older prices, they may be slow to react to recent market changes. This lagging effect can result in delayed signals and missed trading opportunities.
Exponential Moving Average (EMA)
To address the lagging issue of SMAs, traders often turn to exponential moving averages (EMAs). EMAs give more weight to recent price data, making them more responsive to market changes. As a result, EMAs are better suited for short-term trading and provide quicker signals.
The calculation of an EMA incorporates a smoothing factor that exponentially weights the recent data points, assigning more significance to the most recent prices. This weighting helps EMAs adapt swiftly to the market conditions, capturing price movements more accurately.
Despite their advantages, EMAs can be more volatile compared to SMAs. This volatility stems from the rapid adjustments to recent price changes. Traders need to carefully analyze EMA signals to avoid false signals caused by excessive market noise.
Comparing SMA and EMA
Both SMA and EMA have their strengths and weaknesses. SMA is useful for identifying long-term trends and significant support/resistance levels, while EMA is more effective for short-term trading and capturing quick price movements. Choosing between them depends on your trading style and timeframe.
Moving Average Crossover Strategy
One popular strategy that utilizes moving averages is the moving average crossover strategy. This strategy involves the use of two moving averages of different lengths, typically a shorter-term moving average and a longer-term moving average.
The concept behind the moving average crossover strategy is to identify potential buy or sell signals when the shorter-term moving average crosses above or below the longer-term moving average. When the shorter-term moving average crosses above the longer-term moving average, it is considered a bullish signal, indicating a potential upward trend. Conversely, when the shorter-term moving average crosses below the longer-term moving average, it is seen as a bearish signal, suggesting a potential downward trend.
Traders using this strategy aim to enter trades when the crossover occurs and exit when the opposite crossover takes place. The moving average crossover strategy helps traders capture the momentum of a trend and avoid getting caught in sideways or range-bound markets.
It is important to note that the moving average crossover strategy works best in trending markets. In choppy or highly volatile markets, false signals may occur more frequently, leading to potential losses. Therefore, it is crucial to combine the moving average crossover strategy with other indicators or filters to confirm signals and reduce false positives.
Length of Moving Averages
The length of moving averages refers to the number of periods used in the calculation of the moving average. It plays a significant role in determining the sensitivity and responsiveness of the moving average to price changes.
Shorter moving averages, such as 10-day or 20-day moving averages, respond quickly to price fluctuations and are well-suited for short-term trading. They provide more timely signals but may also generate more false signals due to increased sensitivity to market noise.
On the other hand, longer moving averages, such as 50-day or 200-day moving averages, smooth out price data over a longer period, resulting in slower and more reliable signals. They are commonly used to identify long-term trends and major support/resistance levels.
Selecting the appropriate length of moving averages depends on various factors, including the trading timeframe, market volatility, and personal trading preferences. Traders often experiment with different lengths to find the optimal balance between responsiveness and reliability for their specific trading strategy.
Moving Averages and Trend Identification
One of the primary uses of moving averages in day trading is trend identification. Moving averages help traders determine the direction of the prevailing trend and potentially capture profitable trades within that trend.
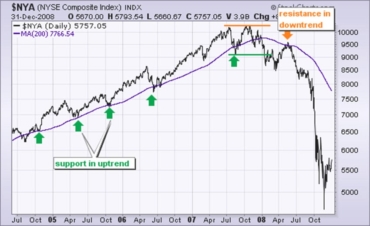
When a market is in an uptrend, the price tends to stay above the moving average, with the moving average acting as a support level. Conversely, in a downtrend, the price generally stays below the moving average, which now acts as a resistance level. By observing the relationship between the price and the moving average, traders can gauge the strength and sustainability of a trend.
The slope of the moving average can provide further insights into the trend. If the moving average is sloping upward, it indicates a bullish trend. In contrast, a downward slope suggests a bearish trend. Flat or sideways-moving averages indicate a lack of clear trend and a potential range-bound market.
Combining multiple moving averages of different lengths can enhance trend identification. For example, a trader may use a shorter-term moving average to capture short-term trends and a longer-term moving average to confirm the overall direction of the market.
It is important to note that moving averages may not be foolproof in identifying trends, especially during periods of high volatility or when the market is experiencing sudden reversals. Therefore, it is advisable to use moving averages in conjunction with other trend-confirming indicators or tools to increase the accuracy of trend identification.
Best moving averages for day trading: Practical Application
In this case study, we will explore the practical application of moving averages in trend identification for day trading. We will examine a specific example where moving averages play a crucial role in determining the prevailing trend and capturing profitable trades.
Case Scenario:
Let’s consider a day trader named Sarah who focuses on trading stocks. Sarah has been using technical analysis to identify potential trade opportunities, and she recognizes the importance of moving averages in trend identification. She decides to employ moving averages to enhance her trading strategy and increase her chances of success.
Step 1: Setting Up Moving Averages:
Sarah begins by selecting two moving averages of different lengths: a 50-day moving average (50MA) and a 200-day moving average (200MA). She chooses these specific lengths to capture both short-term and long-term trends in the stock market.
Step 2: Identifying the Trend:
Sarah observes the price chart of a particular stock she is interested in. She plots the 50MA and 200MA on the chart and looks for their relationship with the price.
Upon analysis, she notices that when the price remains consistently above both moving averages, it indicates a strong uptrend. This scenario suggests that the stock’s price is supported by the moving averages, acting as dynamic support levels.
On the other hand, if the price consistently stays below both moving averages, it signifies a strong downtrend. The moving averages now act as dynamic resistance levels, capping the upside potential.
Step 3: Analyzing Moving Average Slopes:
Sarah understands that the slope of the moving averages provides additional insights into the trend’s strength. A rising 50MA indicates a bullish trend, while a falling 50MA suggests a bearish trend. Similarly, a rising or falling 200MA reflects the overall long-term trend.
She pays close attention to the slopes of the moving averages and looks for confirmation of the trend. If both moving averages slope upward, it strengthens the bullish case. Conversely, if both moving averages slope downward, it confirms the bearish sentiment.
Step 4: Identifying Trade Opportunities:
With a clear understanding of the trend based on moving averages, Sarah identifies potential trade opportunities.
During an uptrend, Sarah looks for buying opportunities when the price retraces to the moving averages. The 50MA acts as a short-term support level, while the 200MA serves as a more significant support level. Sarah waits for the price to touch or bounce off these moving averages and confirms the presence of buying pressure before entering a long trade.
In a downtrend, Sarah seeks selling or shorting opportunities when the price approaches the moving averages from below. She waits for the price to encounter resistance at the moving averages and confirms the presence of selling pressure before entering a short trade.
Step 5: Risk Management and Trade Execution:
Sarah understands the importance of risk management in day trading. She sets appropriate stop-loss levels to limit potential losses if the trade goes against her. She also sets profit targets based on her risk-reward ratio to secure profits.
By incorporating moving averages into her day trading strategy, Sarah successfully identifies trends and takes advantage of potential trade opportunities. The moving averages act as reliable indicators of the prevailing trend, providing support/resistance levels and confirming trade setups.
However, Sarah acknowledges that moving averages are not foolproof and should be used in conjunction with other technical indicators and risk management techniques. She continues to refine her strategy, test different moving average lengths, and adapt to changing market conditions.
Remember, this case study highlights a specific example, and results may vary depending on market conditions, individual trading styles, and risk tolerance. It is crucial for day traders to thoroughly understand moving averages and practice diligent analysis and risk management to make informed trading decisions.
Moving Averages and Support/Resistance Levels
Support and resistance levels are significant price levels that act as barriers to price movements. Moving averages can help identify these levels, making them valuable tools for day traders.
In an uptrend, moving averages can act as dynamic support levels, where the price bounces off the moving average and continues its upward movement. Traders often look for buying opportunities when the price retraces to the moving average, anticipating a potential bounce and a continuation of the trend.
Conversely, in a downtrend, moving averages serve as dynamic resistance levels. The price may find resistance near the moving average and potentially reverse its downward movement. Traders may consider selling or shorting opportunities when the price approaches the moving average from below.
Identifying support and resistance levels using moving averages is not limited to a single moving average. Traders may use multiple moving averages of different lengths to identify stronger support and resistance zones. When multiple moving averages converge or align in close proximity, they create a zone of increased support or resistance, indicating a potentially stronger level to watch for trading opportunities.
Combining the concept of moving averages with support and resistance levels allows traders to make more informed decisions regarding entry and exit points, managing risk, and setting profit targets.
Other Types of Moving Averages
While simple moving averages (SMA) and exponential moving averages (EMA) are the most commonly used moving averages in day trading, there are other types of moving averages worth exploring.
- Weighted Moving Average (WMA): The weighted moving average assigns more weight to recent prices, similar to the exponential moving average. However, the calculation of the WMA differs, giving greater importance to the most recent data points. WMAs can provide a balance between SMAs and EMAs, offering a compromise between responsiveness and reliability.
- Triangular Moving Average (TMA): The triangular moving average is a smoothed moving average that assigns equal weight to each price point within the selected period. TMAs reduce the impact of outliers and provide a smoother representation of price movements. Traders may use TMAs to filter out market noise and capture the underlying trend.
- Volume Weighted Moving Average (VWMA): The volume weighted moving average incorporates trading volume into its calculation. It places more weight on periods with higher trading volume, considering that higher volume reflects increased market activity and potentially stronger price movements. VWMA is particularly useful for analyzing stocks and other assets with varying levels of trading volume.
When exploring alternative types of moving averages, it is crucial to understand their specific characteristics, strengths, and limitations. Traders should test and compare different types of moving averages to determine which ones align best with their trading strategy and objectives.
Tips for Effective Use of Moving Averages
To maximize the effectiveness of moving averages in day trading, consider the following tips:
- Combine Moving Averages with Other Indicators: Moving averages work best when used in conjunction with other technical indicators, such as oscillators, volume analysis, or trendlines. Combining indicators provides a more comprehensive view of the market and increases the likelihood of accurate trade signals.
- Backtest and Optimize Moving Average Parameters: Before applying moving averages to real-time trading, conduct thorough backtesting to assess their performance under different market conditions. Adjust the length and type of moving averages to find the parameters that work best for your trading strategy.
- Consider Multiple Timeframes: Analyzing moving averages across multiple timeframes can provide a broader perspective on trends and potential trade setups. Aligning moving averages on different timeframes can enhance the confirmation of signals and increase the probability of successful trades.
- Use Moving Averages in Conjunction with Price Action: Price action analysis, such as candlestick patterns or chart patterns, can provide valuable insights when combined with moving averages. Look for confluence between moving average signals and price action to increase the reliability of trade setups.
- Manage Risk and Set Realistic Expectations: While moving averages can help identify potential trade opportunities, it is crucial to implement proper risk management techniques. Set realistic profit targets and adhere to strict stop-loss levels to protect your capital.
Remember that no single indicator or strategy guarantees consistent profits in day trading. Moving averages are tools that assist in decision-making, but success ultimately depends on a trader’s skill, experience, and ability to adapt to changing market conditions.
FAQs (Frequently Asked Questions)
- Q: Can moving averages be used for intraday trading? A: Yes, moving averages are commonly used in intraday trading to identify short-term trends, support/resistance levels, and potential trade setups. Traders often select shorter-term moving averages for intraday analysis.
- Q: Are moving averages effective in volatile markets? A: Moving averages can be used in volatile markets; however, it is important to exercise caution and consider the increased likelihood of false signals. Adjusting the length or type of moving averages and using additional filters or indicators can help manage volatility.
- Q: Can moving averages be applied to different financial markets? A: Yes, moving averages can be applied to various financial markets, including stocks, forex, commodities, and cryptocurrencies. However, it is essential to consider the specific characteristics of each market and adapt the parameters of moving averages accordingly.
- Q: Do moving averages work better in trending or range-bound markets? A: Moving averages are most effective in trending markets, where they help identify the direction and strength of the trend. In range-bound markets, where the price oscillates between support and resistance levels, moving averages may generate more false signals.
- Q: Can I automate trading strategies based on moving averages? A: Yes, many trading platforms and software allow the automation of strategies based on moving averages. Traders can program their rules and criteria, enabling the system to generate trade signals and execute trades automatically.