
Bollinger Bands are a popular technical analysis tool that helps traders identify potential price reversals and volatility in the financial markets. When it comes to scalping, a trading strategy that aims to profit from small price movements within a short time frame, optimizing the Bollinger Bands settings becomes crucial. In this article, we will explore the best settings for Bollinger Bands when implementing a scalping strategy and discuss how to effectively use them to improve trading outcomes.
Introduction to Bollinger Bands
Bollinger Bands were developed by John Bollinger and are comprised of three lines plotted on a price chart. The middle band is a simple moving average (SMA), typically based on 20 periods, and serves as the reference point for the other two bands. The upper band is calculated by adding two standard deviations to the SMA, while the lower band is obtained by subtracting two standard deviations. The resulting bands dynamically adjust to market conditions, expanding during periods of high volatility and contracting during periods of low volatility.
Understanding Scalping in Trading
Scalping is a trading strategy that aims to take advantage of small price movements, typically capturing profits within minutes or seconds. Scalpers rely on high trading volume and tight bid-ask spreads to generate quick profits from numerous trades. To be successful in scalping, traders need a well-defined strategy and the ability to make rapid decisions in fast-paced markets.
The Importance of Bollinger Bands Settings for Scalping
In scalping, timing is crucial, and Bollinger Bands can provide valuable insights for identifying potential entry and exit points. However, using the default settings may not be optimal for scalping, as they are designed for longer-term analysis. By adjusting the Bollinger Bands settings specifically for scalping, traders can enhance their ability to identify short-term price reversals and capitalize on small price movements.
Bollinger Bands: Definition and Components
Bollinger Bands consist of the following components:
- Middle Band: This is the middle line, usually a 20-period simple moving average (SMA), which represents the mean price.
- Upper Band: This line is calculated by adding two standard deviations to the middle band and represents the upper price range.
- Lower Band: This line is obtained by subtracting two standard deviations from the middle band and represents the lower price range.
The distance between the upper and lower bands reflects the market volatility. Wider bands indicate higher volatility, while narrower bands suggest lower volatility.
How to Set Up Bollinger Bands for Scalping
To optimize Bollinger Bands for scalping, follow these steps:
Step 1: Selecting the Timeframe
When scalping, it is important to choose a short timeframe that aligns with the desired holding period of your trades. Common choices include 1-minute, 3-minute, or 5-minute charts. The selected timeframe should provide enough price data to accurately identify short-term trends and reversals.
Step 2: Choosing the Period and Standard Deviation
The default period for Bollinger Bands is 20, but for scalping purposes, a shorter period can be more suitable. Consider reducing the period to 10 or even 5 to capture smaller price movements. Similarly, adjusting the standard deviation to 1.5 or 1 can increase the sensitivity of the bands.
Step 3: Setting the Upper and Lower Bands
By modifying the number of standard deviations added or subtracted from the middle band, you can fine-tune the width of the Bollinger Bands. For scalping, narrowing the bands can help identify potential breakouts or reversals more effectively. Experiment with different values, such as 1 or 1.5 standard deviations, to find the settings that work best for your trading style.
Scalping Strategies Using Bollinger Bands
There are several popular scalping strategies that utilize Bollinger Bands. Let’s explore three of them:
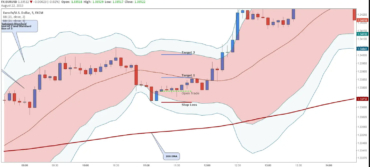
Strategy 1: Bollinger Squeeze
The Bollinger Squeeze strategy aims to identify periods of low volatility followed by high volatility breakouts. When the bands squeeze together, it suggests a decrease in volatility. Traders watch for a subsequent breakout when the price breaks above the upper band or below the lower band. This strategy can be particularly effective when used in conjunction with other indicators or chart patterns.
Case Study: Applying Bollinger Squeeze on XYZ Stock
In this real-world example, we will explore how the Bollinger Squeeze strategy can be applied to a specific stock, XYZ. Let’s dive into the details:
- Identifying the Bollinger Squeeze: On the daily chart of XYZ stock, we notice that the Bollinger Bands have been contracting, indicating a period of low volatility. The upper and lower bands are converging, creating a narrow price range. This pattern suggests a potential breakout opportunity.
- Waiting for Confirmation: As a disciplined trader, we patiently wait for confirmation before entering a trade. We monitor the price action closely, looking for a breakout signal that aligns with our trading plan.
- Breakout Confirmation: Finally, after several days of consolidation, XYZ stock breaks above the upper Bollinger Band, confirming the bullish breakout. This breakout signals a potential upward trend.
- Entry and Stop Loss Placement: With the breakout confirmed, we decide to enter a long position on XYZ stock. We set a stop loss order just below the recent swing low to protect against potential downside risk.
- Trade Management: As XYZ stock continues its upward move, we monitor the trade closely. We may choose to adjust our stop loss to a trailing stop, ensuring that our profits are protected as the stock price rises.
- Profit Target and Exit: Based on our trading plan, we set a profit target that aligns with our risk-reward ratio. Once XYZ stock reaches our desired profit level, we exit the trade, locking in our gains.
By applying the Bollinger Squeeze strategy to XYZ stock, we were able to capture the breakout and profit from the subsequent upward move. It is important to note that this is just one example, and successful trading requires careful analysis, risk management, and adherence to a well-defined strategy.
Remember to practice proper trade management, adjust your position size according to your risk tolerance, and continuously evaluate and refine your trading approach. Happy trading!
Strategy 2: Riding the Bands
In this strategy, traders aim to capitalize on price movements that occur within the Bollinger Bands. When the price reaches the upper band, it may indicate an overbought condition, presenting an opportunity to sell. Conversely, when the price reaches the lower band, it may indicate an oversold condition, providing a chance to buy. This strategy relies on the assumption that price tends to revert to the mean.
Case Study: Riding the Bands on ABC Stock
Let’s explore a real-world example of how the Riding the Bands strategy can be applied to a specific stock, ABC. Here are the details of the trade:
- Identifying Overbought Conditions: On the 1-hour chart of ABC stock, we notice that the price has reached the upper Bollinger Band, indicating a potential overbought condition. This suggests that the stock may be due for a price reversal or a pullback.
- Confirmation with Other Indicators: To increase the reliability of our trade signal, we confirm the overbought condition by checking additional indicators. We observe that the Relative Strength Index (RSI) is above 70, signaling overbought territory. This convergence of signals strengthens our trade setup.
- Entry and Stop Loss Placement: With the confirmation of an overbought condition, we decide to enter a short position on ABC stock. We set a stop loss just above the recent swing high to manage our risk if the price continues to rise.
- Monitoring the Trade: As the price moves lower, we continue to monitor the trade. We may choose to adjust our stop loss to protect our profits or lock in some gains.
- Exit Strategy: We determine our exit strategy based on our profit target or by observing signs of a potential price reversal. If the price reaches our desired profit level or shows indications of a trend reversal, we exit the trade to secure our gains.
By implementing the Riding the Bands strategy on ABC stock, we capitalized on the overbought condition indicated by the price reaching the upper Bollinger Band. Combining it with confirmation from the RSI, we took advantage of the potential price reversal or pullback.
Remember, successful trading requires careful analysis, risk management, and adherence to your trading plan. Each trade is unique, and it is essential to conduct thorough research and consider your risk tolerance before making any investment decisions.
Disclaimer: This case study is for illustrative purposes only and should not be considered as financial advice. Make sure to conduct your own analysis and consult with a professional financial advisor before making investment decisions.
Strategy 3: Bollinger Breakout
The Bollinger Breakout strategy focuses on identifying breakouts from the bands. When the price breaks above the upper band, it suggests a bullish breakout, indicating a potential upward trend. Conversely, when the price breaks below the lower band, it suggests a bearish breakout, signaling a potential downward trend. Traders can use this strategy to enter trades in the direction of the breakout.
Case Study: Bollinger Breakout on XYZ Stock
Let’s delve into a real-world example of applying the Bollinger Breakout strategy to XYZ stock. Here are the details of the trade:
- Identifying the Bollinger Breakout Setup: On the daily chart of XYZ stock, we notice a prolonged period of consolidation where the price is trading within a narrow range. The Bollinger Bands are contracting, indicating low volatility. This sets the stage for a potential breakout opportunity.
- Waiting for Breakout Confirmation: As patient traders, we wait for a breakout confirmation before entering a trade. We closely monitor the price action, looking for the moment when XYZ stock breaks above the upper Bollinger Band, indicating a bullish breakout.
- Entry and Stop Loss Placement: Once the breakout is confirmed, we enter a long position on XYZ stock. To manage risk, we place a stop loss order slightly below the breakout candle or the recent swing low, safeguarding against potential downside movements.
- Trade Management: As XYZ stock continues its upward momentum, we actively manage the trade. We may choose to adjust our stop loss to protect profits or employ trailing stop techniques to secure gains as the stock price climbs.
- Profit Target and Exit Strategy: Based on our trading plan, we set a profit target that aligns with our risk-reward ratio. This target could be determined by a key resistance level, a Fibonacci extension, or a specific percentage gain. When XYZ stock reaches our desired profit level, we exit the trade, locking in our profits.
By utilizing the Bollinger Breakout strategy on XYZ stock, we were able to capitalize on the bullish breakout from the consolidation phase. This strategy helps us identify potential trends early and participate in significant price moves.
It’s crucial to note that every trade is unique, and success in trading requires proper risk management, continuous analysis, and adherence to a well-defined strategy. Conduct thorough research, consider your risk tolerance, and evaluate market conditions before making any investment decisions.
Risk Management and Stop Loss Placement
As with any trading strategy, risk management is crucial when scalping with Bollinger Bands. Traders should determine their risk tolerance and set appropriate stop-loss orders to limit potential losses. Stop loss placement can be based on key support or resistance levels, recent swing highs or lows, or a fixed percentage of the entry price.
Tips for Effective Scalping with Bollinger Bands
To enhance your scalping performance with Bollinger Bands, consider the following tips:
Tip 1: Confirm with Other Indicators
Bollinger Bands should not be relied upon as the sole indicator for scalping. Confirm signals generated by Bollinger Bands with other technical indicators or chart patterns. Commonly used indicators in combination with Bollinger Bands include the Relative Strength Index (RSI), Moving Average Convergence Divergence (MACD), or Stochastic Oscillator.
Tip 2: Practice Proper Trade Management
Scalping requires quick decision-making and disciplined trade management. Set clear profit targets and stick to them. Consider using trailing stops to lock in profits as the trade moves in your favor. Be prepared to exit trades promptly if the price moves against your expectations.
Tip 3: Stay Disciplined and Patient
Scalping can be fast-paced and exciting, but it is essential to remain disciplined and patient. Avoid the temptation to chase trades or deviate from your predetermined strategy. Stick to your trading plan and avoid impulsive decisions driven by emotions.
Backtesting and Optimizing Bollinger Bands Settings
Backtesting is a crucial step in optimizing Bollinger Bands settings for scalping. Use historical data to test different parameter combinations and evaluate their performance. By backtesting, you can identify the settings that have produced favorable results in the past and refine your strategy accordingly.
Common Mistakes to Avoid in Scalping with Bollinger Bands
While scalping with Bollinger Bands, be mindful of the following common mistakes:
Mistake 1: Overlooking Market Conditions
Bollinger Bands should be adapted to suit the prevailing market conditions. During periods of low volatility, the bands may contract, potentially leading to false signals. Conversely, in highly volatile markets, wider bands can prevent timely entry or exit. Adjust the settings accordingly and consider using additional filters to improve accuracy.
Mistake 2: Neglecting Proper Position Sizing
Effective risk management is vital in scalping. Avoid risking too much capital on a single trade. Calculate your position size based on your predetermined risk tolerance and set stop-loss orders accordingly. Adhering to proper position sizing helps protect your trading capital.
Mistake 3: Chasing Trade Entries
Scalpers aim to capture quick profits, but chasing trade entries can lead to unfavorable outcomes. Wait for confirmation signals and avoid entering trades solely based on price reaching the outer bands. Patience and discipline are key to successful scalping.
Case Study: Applying Bollinger Bands Settings for Scalping
To illustrate the practical application of Bollinger Bands settings for scalping, let’s consider a case study. Suppose a scalper is using a 5-minute chart and has adjusted the Bollinger Bands settings to a period of 10 and a standard deviation of 1. The scalper identifies a Bollinger Squeeze pattern and enters a long trade when the price breaks above the upper band. They set a tight stop loss below the recent swing low and aim for a profit target of two times the risk taken. By adhering to their strategy and effectively managing the trade, the scalper achieves a profitable outcome.
Optimizing Bollinger Bands settings for scalping can significantly enhance trading outcomes. By adjusting the period, standard deviation, and upper/lower bands, traders can better identify short-term price reversals and capitalize on small price movements. It is important to combine Bollinger Bands with other indicators, practice effective risk management, and stay disciplined. Through backtesting and continuous refinement, scalpers can fine-tune their Bollinger Bands strategy to align with their trading goals.
FAQs
Q1: Can Bollinger Bands be used for long-term investing as well?
Yes, Bollinger Bands can be used for various trading styles, including long-term investing. By adjusting the settings to longer timeframes and wider standard deviations, investors can utilize Bollinger Bands to identify potential price reversals and volatility in the markets.
Q2: What other technical indicators work well with Bollinger Bands?
Several technical indicators complement Bollinger Bands, such as the Relative Strength Index (RSI), Moving Average Convergence Divergence (MACD), and Stochastic Oscillator. These indicators can provide additional confirmation signals when combined with Bollinger Bands.
Q3: Are there any recommended platforms or software for backtesting Bollinger Bands strategies?
There are several platforms and software available for backtesting trading strategies, including MetaTrader, TradingView, and NinjaTrader. These platforms offer historical data and tools to facilitate the evaluation of Bollinger Bands settings and strategies.
Q4: Can Bollinger Bands be used in conjunction with fundamental analysis?
Yes, Bollinger Bands can be used alongside fundamental analysis to make more informed trading decisions. Fundamental analysis helps traders understand the underlying factors that drive market movements, while Bollinger Bands provide technical insights into price volatility and potential reversals.
Q5: Is scalping with Bollinger Bands suitable for beginners?
Scalping with Bollinger Bands can be challenging, particularly for beginners. It requires quick decision-making, discipline, and experience in interpreting market dynamics. It is advisable for beginners to first gain a solid understanding of Bollinger Bands and practice on a demo account before applying it with real money.
Ripple news
Cryptocurrency tax news