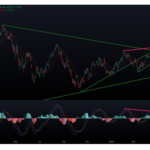
The S&P 500 Technical Analysis: Navigating the AI Boom and its Impact on the Stock Market
The S&P 500, a widely followed stock market index, has been experiencing significant shifts in recent years. As of 2023, the stock market has shown remarkable resilience, with the S&P 500 reaching new heights. In this article, we will explore the journey of the S&P 500 technical analysis for the first half of 2023, delve […]


