Skip to content
Menu
  • Home
  • Investment Options
    • Stock Trading
    • Dividend Investing
  • Stock Market
  • Technical Analysis
  • Recent News
  • Guides
    • Markets
    • The ICO List

InvestPips

Your Gateway to Smart Investing

InvestPips
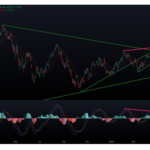
Illustration showing the S&P 500 technical analysis chart with an upward trend, symbolizing market growth and the impact of AI on the stock market.

The S&P 500 Technical Analysis: Navigating the AI Boom and its Impact on the Stock Market

July 2, 2023
S&P 500 Technical Analysis

The S&P 500, a widely followed stock market index, has been experiencing significant shifts in recent years. As of 2023, the stock market has shown remarkable resilience, with the S&P 500 reaching new heights. In this article, we will explore the journey of the S&P 500 technical analysis for the first half of 2023, delve […]

Read More   

S&P 500 Technical Analysis Daily Update – June 5th 2023

June 5, 2023
S&P 500 Technical Analysis

Welcome back to our daily S&P 500 technical analysis update! In today’s video, we’ll be covering some key topics that you should consider when analyzing the S&P 500 index from a technical perspective. So, let’s dive right in Before we start, it’s important to note that technical analysis involves studying historical price and volume data […]

Read More   
Showing a daily update on the S&P 500 price movement.

S&P 500 Technical Analysis Daily update – June 2nd, 2023

June 2, 2023
S&P 500 Technical Analysis

Price movement has created a higher high from February 2023 when it was at $4195.34. The MACD indicator is showing that this run up is out of gas. This divergence could be indicative of a price movement down. A price drop would allow the market to gain the momentum needed for a move further up. […]

Read More   

Terms and Conditions - Privacy Policy