When it comes to technical analysis in the world of trading, chart patterns play a crucial role in predicting future price movements. One such pattern that has gained significant attention among traders is the double top chart pattern. In this comprehensive guide, we will delve into the intricacies of the double top chart pattern, exploring its formation, identification, and strategies for trading it effectively. So, fasten your seatbelts and let’s embark on this exciting journey!
Double Top Chart Pattern: Unraveling the Mystery
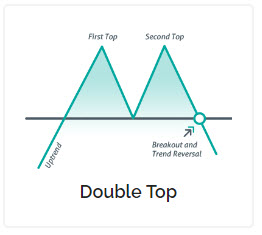
At its core, the double top chart pattern is a bearish reversal pattern that indicates a potential trend reversal from an uptrend to a downtrend. It is formed when an asset’s price reaches a significant high, experiences a temporary pullback, and then rallies back to the previous high, only to be rejected once again. This rejection forms the second peak of the pattern, creating a distinct “M” shape on the price chart. The double top chart pattern signifies a loss of bullish momentum and often serves as a precursor to a downward price movement.
Identifying the Double Top Chart Pattern
Spotting the Telltale Signs
To successfully identify the double top chart pattern, traders need to keep a keen eye on specific characteristics that define its formation. Let’s explore the key signs to watch out for:
- Price Reaches a High: The pattern starts with the price reaching a notable high, signifying the first peak.
- Pullback: After the initial high, the price retraces, forming a temporary pullback. This pullback is often seen as a healthy correction within the uptrend.
- Second Rally: Following the pullback, the price makes a second attempt to reach the previous high. This forms the second peak of the pattern.
- Resistance Level: The price fails to break above the resistance level created by the first peak, confirming the pattern’s formation.
Visualization through Price Chart
A picture is worth a thousand words, and in the case of technical analysis, a price chart speaks volumes. Let’s take a moment to visualize the double top chart pattern through a hypothetical example:
In the above chart, we can observe the formation of the double top pattern. The price initially reaches a high, followed by a pullback. Subsequently, a second rally takes place but fails to break above the resistance level, confirming the pattern.
Trading Strategies for Double Top Chart Pattern
Timing Your Trades with Precision
Now that we have gained a solid understanding of how to identify the double top chart pattern, it’s time to explore some effective trading strategies to capitalize on this bearish reversal pattern.
- Confirmation: Wait for Price Confirmation – It is crucial to wait for confirmation before entering a trade based on the double top chart pattern. Traders often look for a decisive close below the pattern’s neckline as a confirmation signal.
- Entry Point: Short Position – Once the pattern is confirmed, traders can consider entering a short position, anticipating a downward price movement. Entry points can be set slightly below the neckline to ensure a favorable risk-reward ratio.
- Stop Loss: Protecting Your Capital – To manage risk, it is prudent to place a stop-loss order slightly above the pattern’s second peak. This helps limit potential losses in case the pattern fails and the price breaks out to the upside.
- Target Price: Setting Realistic Expectations – Setting a target price is crucial for any trade. Traders often project the pattern’s height from the neckline breakout point and use it as a guide to set a realistic profit target.
- Volume Analysis: Confirming Bearish Bias – Analyzing volume can provide additional insights into the strength of the pattern. Traders often look for an increase in volume during the pattern formation, indicating higher selling pressure.
Real-Life Example
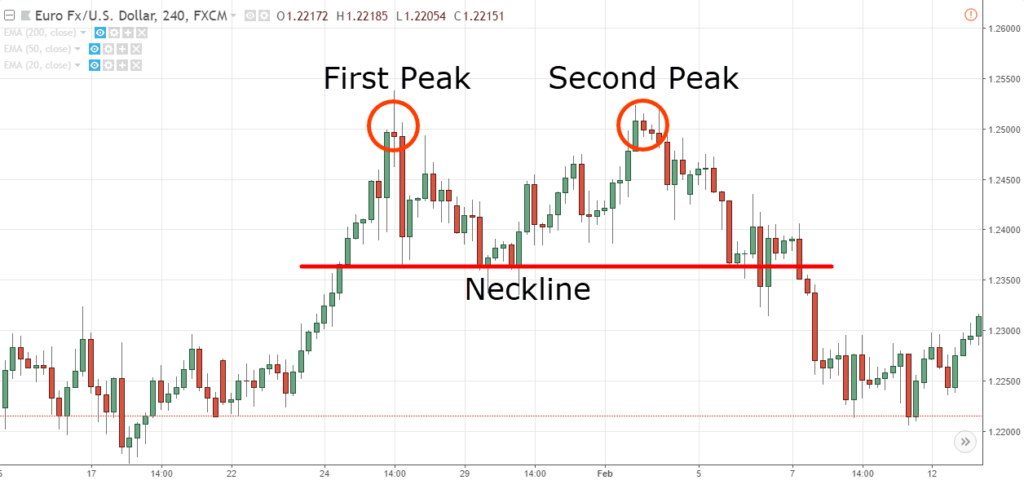
To illustrate the practical application of trading strategies for the double top chart pattern, let’s consider an example involving Euro/USD

In the above chart, we can see the formation of a double top pattern in the Forex of Euro/USD. Traders who followed the identified strategies could have potentially entered a short position after the neckline breakout, protected their capital with a stop-loss order, and exited the trade at the projected target price.
FAQs (Frequently Asked Questions)
Q1: What is the significance of the double top chart pattern?
This chart pattern indicates a potential trend reversal from an uptrend to a downtrend. It suggests a loss of bullish momentum and can serve as a valuable signal for traders to consider short positions.
Q2: Are there any variations of the double top chart pattern?
Yes, there are variations of this chart pattern, such as the triple top pattern and the head and shoulders pattern. These variations share similar characteristics but have distinct formations and implications.
Q3: Can the double top chart pattern appear in any timeframe?
Yes, this chart pattern can appear in various timeframes, ranging from intraday charts to long-term charts. The significance of the pattern remains consistent regardless of the timeframe.
Q4: How reliable is the double top chart pattern?
Like any technical analysis pattern, the reliability of this chart pattern depends on various factors, such as the overall market conditions, volume, and price behavior. It is crucial to consider additional indicators and analysis tools for confirmation.
Q5: Are there any other reversal patterns to watch out for?
Yes, in addition to this chart pattern, traders also keep an eye out for other reversal patterns like the double bottom, head and shoulders, and triple bottom. Each pattern carries its own unique characteristics and implications.
Q6: What is the best way to improve my ability to spot the double top chart pattern?
Improving your ability to spot this chart pattern comes with experience and practice. Regularly analyzing price charts, studying historical patterns, and keeping up with market news and analysis can significantly enhance your pattern recognition skills.
In conclusion, this chart pattern is a powerful tool in a trader’s arsenal, enabling them to identify potential trend reversals and capitalize on bearish opportunities. By understanding the formation of the pattern, employing effective trading strategies, and considering additional indicators, traders can enhance their chances of making informed trading decisions. Remember, practice makes perfect, so keep honing your skills and exploring the fascinating world of technical analysis.

