S&P 500 Technical Analysis Daily update – June 2nd, 2023
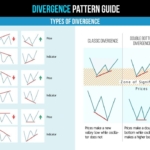
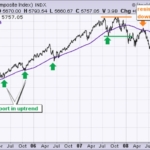
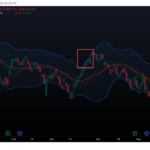
Price movement has created a higher high from February 2023 when it was at $4195.34. The MACD indicator is showing that this run up is out of gas. This divergence could be indicative of a price movement down. A price drop would allow the market to gain the momentum needed for a move further up. […]