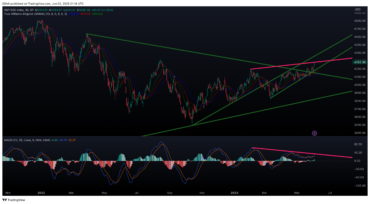
Price movement has created a higher high from February 2023 when it was at $4195.34. The MACD indicator is showing that this run up is out of gas. This divergence could be indicative of a price movement down. A price drop would allow the market to gain the momentum needed for a move further up. That pull back may happen as the S&P 500 attempts to test the high from August 2022 of $4325.28. If the price does break and close above the $4325.28, it might create a FOMO break out. The healthiest price movement would be a move down $4100 before continuing up. We will see what Monday June 5th, 2023 has in store.


S&P 500 Technical Analysis Daily update – June 2nd, 2023