
Bollinger Bands are a popular technical analysis tool used by traders and investors to assess price volatility and identify potential trading opportunities. Developed by John Bollinger in the 1980s, they consist of a set of three lines plotted on a price chart. They help traders visualize price movements and determine the upper and lower price levels that are likely to contain most of the price action.
How Do They Work?
They are composed of three lines: the middle band, the upper band, and the lower band. The middle band is typically a simple moving average (SMA) of the price, while the upper and lower bands are derived by adding and subtracting a certain number of standard deviations from the middle band. The standard deviation is a measure of price volatility.
The width of the Bollinger Bands varies based on the volatility of the underlying asset. During periods of high volatility, the bands expand, indicating wider price ranges. Conversely, in low-volatility periods, the bands contract, suggesting narrower price ranges. Traders can use this information to gauge the market’s sentiment and potential future price movements.
The Components of Bollinger Bands
- Middle Band (MB): The middle band is typically a 20-day simple moving average (SMA) of the price.
- Upper Band (UB): The upper band is calculated by adding two standard deviations to the middle band.
- Lower Band (LB): The lower band is calculated by subtracting two standard deviations from the middle band.
Calculating them
To calculate Bollinger Bands, you need to follow these steps:
- Choose a period (usually 20) for the simple moving average (SMA).
- Calculate the standard deviation of the price for the same period.
- Multiply the standard deviation by a factor (usually 2) to determine the width of the bands.
- Add the standard deviation multiplied by the factor to the SMA to get the upper band.
- Subtract the standard deviation multiplied by the factor from the SMA to get the lower band.
Interpretation of Bollinger Bands
Traders interpret them in several ways:
- When the price touches the upper band, it may indicate an overbought condition, suggesting a potential reversal or a pause in the upward trend.
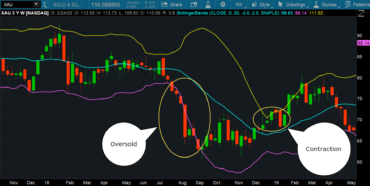
- When the price touches the lower band, it may indicate an oversold condition, suggesting a potential reversal or a pause in the downward trend.
- When the price moves between the upper and lower bands, it suggests a range-bound market with no clear trend.
- A sudden expansion or contraction of the bands indicates a significant increase or decrease in volatility, respectively.
Use as a Volatility Indicator
Bollinger Bands are widely used as a volatility indicator. Traders often observe the width of the bands to assess market volatility. Narrow bands indicate low volatility, suggesting a period of consolidation, while wide bands indicate high volatility, indicating potential trading opportunities.
Using Bollinger Bands for Trend Analysis
Traders also use them to analyze trends. When the price consistently stays above the middle band, it suggests an uptrend. Conversely, when the price consistently stays below the middle band, it suggests a downtrend. Traders may look for potential buying or selling opportunities when the price pulls back to the middle band in a trending market.
Bollinger Bands and Trading Strategies
Bollinger Bands provide a foundation for various trading strategies. Here are a few common ones:
- Bollinger Squeeze: Traders look for periods of low volatility indicated by the contraction of the bands, anticipating an imminent price breakout.
- Bollinger Breakout: Traders enter positions when the price breaks above the upper band (in an uptrend) or below the lower band (in a downtrend).
- Bollinger Reversal: Traders look for overbought or oversold conditions when the price touches the outer bands, anticipating a reversal in the opposite direction.
Common Misconceptions about BBs
- Alone, they do not provide definitive buy or sell signals. They should be used in conjunction with other technical analysis tools and indicators.
- They cannot predict future price movements with certainty. They are probabilistic in nature and provide a framework for assessing potential outcomes.
- They should be adjusted based on the characteristics of the underlying asset and the desired trading timeframe.
Advantages and Limitations of Bollinger Bands
Advantages:
- They are easy to understand and widely available on most charting platforms.
- They provide visual cues about price volatility and potential trading opportunities.
- They can be used in conjunction with other indicators to enhance trading strategies.
Limitations:
- They are not foolproof and should not be relied upon as the sole basis for making trading decisions.
- During periods of low volatility, they may generate false signals.
- They may not be suitable for all market conditions and asset classes.
Use in Different Markets
While they were initially developed for the stock market, they can be applied to various financial markets, including forex, commodities, and cryptocurrencies. Traders adapt the parameters and timeframes of the bands to suit the characteristics of each market.
Case Study: Using them in Stock Trading
Let’s consider a case study to illustrate the application of Bollinger Bands in stock trading. Suppose we have a stock that has been trending higher for some time. Traders using Bollinger Bands may look for opportunities to buy when the price pulls back to the middle band or sell when the price reaches the upper band. They may also use them in conjunction with other indicators, such as the relative strength index (RSI), to confirm potential trading signals.
Bollinger Bands are a valuable tool in a trader’s toolkit, providing insights into price volatility, trend analysis, and potential trading opportunities. However, they should be used in conjunction with other technical analysis tools and indicators to make informed trading decisions. Understanding the components, calculation, and interpretation of them can help traders harness their power effectively.
FAQs
- Can Bollinger Bands be used in isolation for trading decisions? They should not be used in isolation but in combination with other indicators to validate trading signals.
- Are Bollinger Bands suitable for day trading? Yes, they can be useful for day trading as they provide insights into intraday price volatility.
- What are the recommended parameters for Bollinger Bands? The most commonly used parameters for them are a 20-day simple moving average and two standard deviations.
- Can Bollinger Bands be used for long-term investing? They are primarily used for short-term trading, but they can be applied in conjunction with other tools for long-term investing decisions.
- Do Bollinger Bands work in all market conditions? They work best in trending markets with sufficient volatility. In sideways or range-bound markets, they may generate false signals.
Sources
- Investopedia: www.investopedia.com
- Bollinger Bands Official Website: www.bollingerbands.com
- StockCharts: www.stockcharts.com
- TradingView: www.tradingview.com
- DailyFX: www.dailyfx.com
- Forex.com: www.forex.com
- BabyPips: www.babypips.com