Reviewed October 3, 2026 · Chart-pattern education
Two highs can suggest a top. They do not complete a bearish reversal on their own.
This guide explains the ordinary price-chart version of a double top. The diagram and dollar example are invented teaching material, with no claim of a verified historical trade.
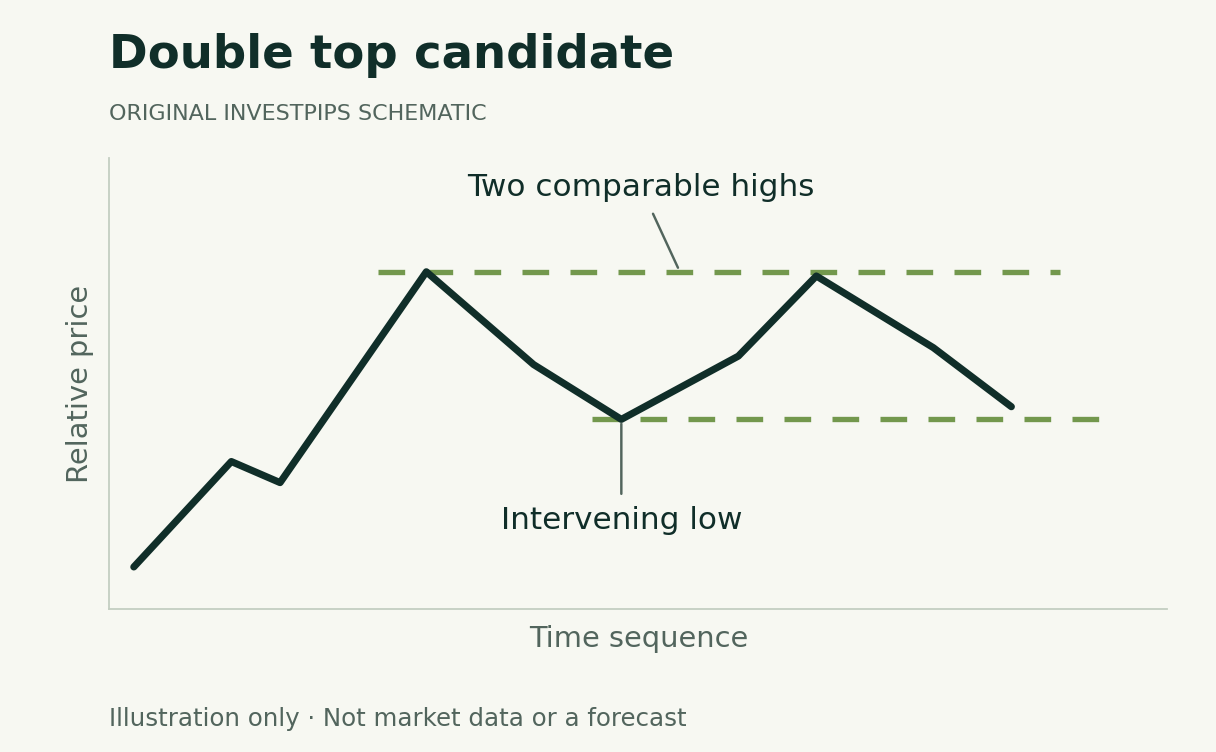
The intervening low and prior trend supply the context.
The observation can still be followed by a recovery.
Two peaks need an intervening low and a prior advance
A double-top candidate has two broadly comparable highs separated by a reaction low after an advance. StockCharts distinguishes the candidate from a completed reversal: the intervening support area must break under the chosen definition. Two peaks alone can remain part of an ongoing range or uptrend.
Scroll across the table to see all columns.
| Stage | Observation | Open question |
|---|---|---|
| Prior advance | Price has been rising over the selected horizon. | Which horizon defines that trend? |
| First high and reaction | A peak is followed by a pullback. | Where is the meaningful intervening low? |
| Second high | Price returns near the earlier high. | Does it turn down, continue higher or move sideways? |
| Support break | The stated condition below the intervening low occurs. | Will the break persist or fail? |
Near-equal highs do not need to match perfectly
A definition should state its tolerance for comparable highs. One observer may use a percentage band; another may use a volatility-based distance. Those choices alter the sample and need to be specified before judging results.
Likewise, decide whether the intervening level uses a low, a closing-price area or another rule. Do not alternate among them simply to make a historical example qualify. A chosen line helps define an observation; it does not prevent price from crossing back.
A hypothetical height projection
Assume invented highs near $80 and an intervening low at $70. Under a conventional measured-move approach, the height is $10 and a downside projection from $70 is $60. No actual security or executed trade is represented.
Scroll across the table to see all columns.
| Step | Calculation |
|---|---|
| Height | $80 − $70 = $10 |
| Projected level | $70 − $10 = $60 |
| If a separate rule assumed a $69 entry | $69 − $60 = $9 to the projected level, before costs |
The calculation supplies neither a success rate nor a time to arrival. It also does not specify an order, an exit if the price rises, or the costs of implementing a bearish position. A $10 pattern height is not automatically $10 of achievable profit.
A second peak can lead to a different outcome
- No support break. Price may continue in the range, leaving the candidate incomplete.
- A renewed advance. Price may rise through the area of the two highs. Record this outcome rather than redrawing the setup to hide it.
- A failed breakdown. Price may break the intervening level and then recover. The completion event does not guarantee its aftermath.
- An execution mismatch. Gaps and available liquidity can produce a result that differs from a chart-based assumption.
Do not confuse ordinary charts with point-and-figure signals
A double-top reversal on a line or candlestick chart is a different definition from a similarly named point-and-figure breakout. Check the chart type before borrowing a rule or a directional label.
A bearish picture is not a short-sale recommendation
The SEC’s short-sale bulletin explains that short positions face potentially unlimited losses as prices rise. A chart pattern cannot establish borrow availability or remove execution risk. Reviewing an existing holding and initiating a short sale are different decisions.
For research, save the candidate before the later bars, document the support-break rule and retain every eligible result. The testing guide explains timing, costs and sample selection. Compare the mirror structure in the double-bottom guide without assuming mirror-image trading outcomes.
Continue learning
Sources and method
Substantively reviewed October 3, 2026. Diagrams and numerical examples are original, synthetic teaching material. They do not reproduce a security’s trading history, a backtest or a validated strategy. Pattern names describe charting conventions; this article assigns no success probability.
Primary references: StockCharts double-top convention; SEC introduction to short sales.
Advertising is separate from this guide. Read our editorial and advertising standards.
What changed in this update
Replaced unsupported real-life trading examples and precision claims with an original schematic and checked arithmetic. Distinguished candidate formation, completion and failure. The original URL and publication date are preserved.
Educational information, not personalized investment advice or a recommendation to trade. A diagram or measured-move projection does not guarantee an outcome.