Reviewed October 3, 2026 · Chart-pattern education
A repeated low is an observation. A completed reversal requires more than the outline of a W.
This guide separates the candidate, the resistance break and the possible failure. It uses an original diagram and invented numbers, not a selected winning trade.
The second need not be exactly equal to or above the first.
That high supplies the conventional resistance area.
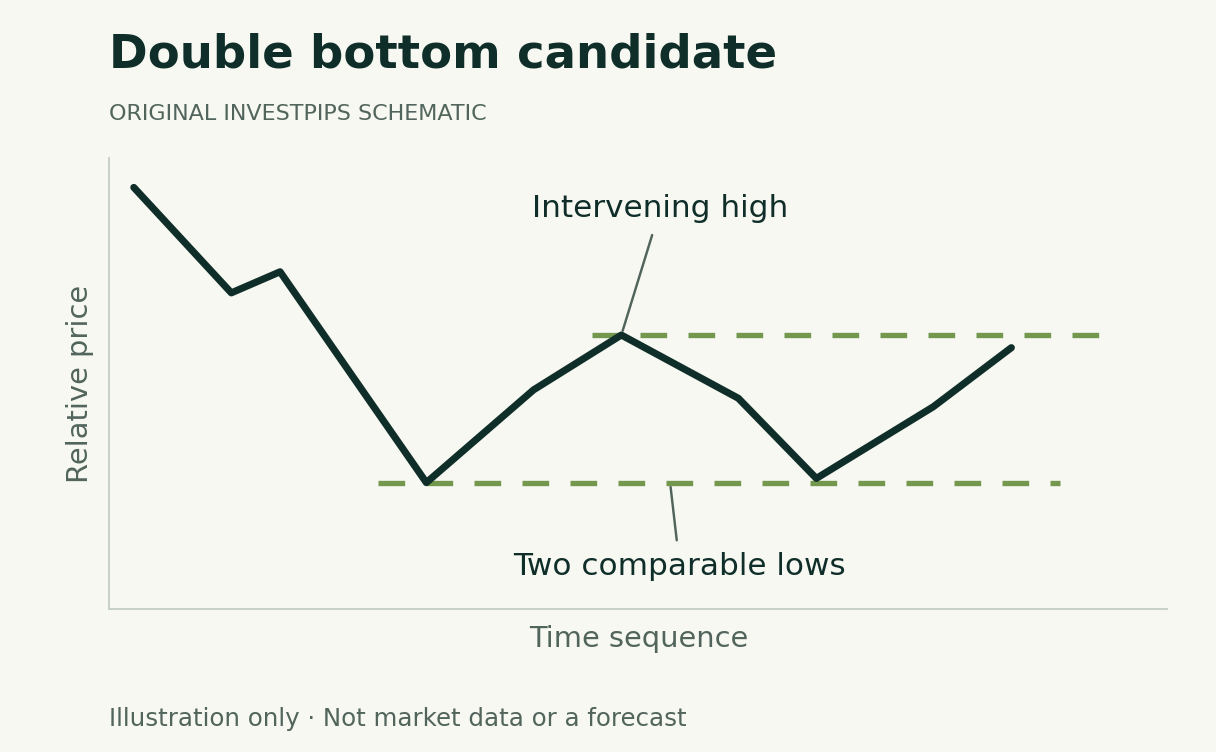
Two lows around an area, with a rebound between them
A double-bottom candidate follows a decline and contains two broadly comparable lows separated by a rebound. StockCharts describes the break of intervening resistance as the completion event in the conventional bullish interpretation. The second low does not have to be higher than the first in every accepted drawing.
Scroll across the table to see all columns.
| Element | What it contributes |
|---|---|
| Prior decline | The trend that a bullish reversal would change. |
| Two separated lows | The observed repeated low area, within a stated tolerance. |
| Intervening rebound | A reference resistance level between the lows. |
| Resistance-break condition | The event that completes the chosen definition. |
A second low alone does not establish a durable floor
The first recovery may fail, the second test may break lower, or the market may continue sideways. Calling the area support describes previous reactions; it does not oblige future buyers to defend it.
Set a rule for how far apart the lows must be and how similar their prices must remain. Adjacent small fluctuations may not be distinct reactions under your definition. Avoid choosing the tolerances only after finding a profitable-looking example.
Do not turn a schematic into a prediction
A clean W-shaped diagram is drawn to teach a sequence. Real charts are less orderly. The drawing does not imply equal timing, exact symmetry, a known buyer or a guaranteed next move.
An invented measured-move example
Assume two lows near $40 and an intervening rebound to $46. Under a conventional height projection, the range is $6 and the projected level after an upside break referenced at $46 is $52. These are chosen teaching inputs, not market observations.
Scroll across the table to see all columns.
| Quantity | Calculation | Limit |
|---|---|---|
| Pattern height | $46 − $40 = $6 | Describes the selected formation. |
| Measured objective | $46 + $6 = $52 | Does not guarantee that $52 will trade. |
| Distance from an assumed $47 entry | $52 − $47 = $5 | Excludes costs and requires a separate executable entry rule. |
If price falls after an apparent break, the projection does not provide protection. An assumed exit and a quantity would still be needed to describe planned loss exposure. The ascending-triangle case study shows why actual loss can exceed a planned amount.
Specify the observation called confirmation
- Choose the resistance reference. Explain whether it is the intervening high, a closing-price area or another documented level.
- Choose the event. A price touch, an intrabar crossing and a completed close are different observations.
- Respect availability. A rebound high may require later bars to be identified under the pivot rule.
- Track the aftermath. Record failed breakouts and continued ranges as well as advances.
- Evaluate additional filters. If adding volume or another indicator, test the extra condition rather than assuming it improves accuracy.
A third low changes the drawing, not the certainty
If another separated low develops, the formation may resemble a triple-bottom candidate. A third test is not proof of a stronger or more profitable signal. The relevant resistance level and completion rule still need to be stated.
This page covers line, bar and candlestick price charts. A point-and-figure double-bottom breakdown is a different definition with a different conventional direction. Use the research guide to keep the chart type and test rules explicit.
Continue learning
Sources and method
Substantively reviewed October 3, 2026. Diagrams and numerical examples are original, synthetic teaching material. They do not reproduce a security’s trading history, a backtest or a validated strategy. Pattern names describe charting conventions; this article assigns no success probability.
Primary references: StockCharts double-bottom convention.
Advertising is separate from this guide. Read our editorial and advertising standards.
What changed in this update
Removed unsupported performance claims and clarified the second-low requirement, intervening resistance and point-and-figure distinction. Added an original candidate diagram and checked example. The original URL and publication date are preserved.
Educational information, not personalized investment advice or a recommendation to trade. A diagram or measured-move projection does not guarantee an outcome.