
Welcome to this comprehensive guide on the cup with handle pattern, an essential tool for technical analysis in stock trading. In this article, we will explore the cup with handle pattern in detail, discussing its definition, characteristics, interpretation, and practical applications. Whether you are a beginner or an experienced trader, understanding this pattern can greatly enhance your ability to identify profitable opportunities in the stock market.
Explained
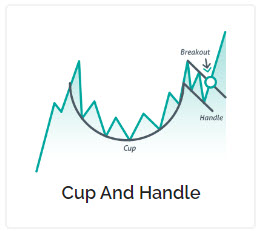
The cup with handle pattern is a technical analysis pattern that occurs in stock price charts. It is a bullish continuation pattern, often found during an uptrend, indicating a temporary pause in the upward movement before the stock resumes its upward trajectory. The pattern resembles a cup (the main body) with a small handle on the right side. Traders consider this pattern as a reliable signal for potential upward price movement.
Characteristics of the Pattern
To identify the cup with handle pattern accurately, we need to look for the following characteristics:
- Cup Shape: The pattern starts with a rounded bottom, forming the shape of a cup. This cup shape should be relatively deep and smooth, indicating a significant correction in the stock’s price.
- Handle Formation: After the cup is formed, a small pullback occurs, creating a handle. The handle represents a short period of consolidation where the stock price retraces slightly before moving higher.
- Duration: The cup with handle pattern typically takes several weeks or months to develop. The longer the duration, the stronger the pattern’s significance.
- Volume: Volume plays a crucial role in confirming the pattern’s validity. During the cup formation, the volume should decrease, signaling a decrease in selling pressure. As the stock breaks out from the handle, the volume should increase, indicating renewed buying interest.
How to Identify the Cup with Handle Pattern
Identifying the cup with handle pattern requires a careful analysis of stock price charts. Here are the steps to follow:
- Step 1: Find the Cup Formation: Look for a rounded bottom in the stock’s price chart, resembling a cup. The left side of the cup should be steep, followed by a smoother and rounded right side.
- Step 2: Spot the Handle: After the cup formation, identify a small pullback in the stock’s price, forming the handle. The handle should ideally retrace no more than one-third of the cup’s depth.
- Step 3: Analyze Volume: During the cup formation, observe the volume. It should decrease as the cup develops. When the stock breaks out from the handle, there should be a noticeable increase in volume, confirming the pattern’s strength.
- Step 4: Confirm the Breakout: Once the handle is formed, monitor the stock closely. A valid cup with handle pattern requires the stock to break out above the handle’s resistance level. This breakout confirms the pattern’s validity and presents a potential buying opportunity.
Interpretation and Trading Strategies
The cup with handle pattern provides valuable insights into the stock’s future price movement. Here are the key interpretations and trading strategies associated with this pattern:
- Price Targets: The cup with handle pattern allows traders to set price targets by measuring the depth of the cup and projecting it upward from the breakout point. This projection gives an estimate of the potential price movement after the breakout.
- Entry Point: Traders often enter a position once the stock breaks out above the handle’s resistance level. This breakout acts as a trigger to initiate a long position, anticipating further price appreciation.
- Stop Loss: To manage risk, it is essential to set a stop loss order below the handle’s support level. This ensures that if the stock fails to sustain the breakout and reverses its direction, the trader exits the position with a limited loss.
- Confirmation: Traders should seek confirmation from other technical indicators, such as moving averages or relative strength index (RSI), to validate the cup with handle pattern’s reliability. Additional confirmation enhances the probability of a successful trade.
FAQs about the Cup with Handle Pattern
Q1: How does the cup with handle pattern differ from other chart patterns?
This pattern is distinct due to its specific shape and characteristics. Unlike other patterns, such as triangles or rectangles, the cup with handle pattern represents a period of consolidation within an overall uptrend. This pattern offers a unique opportunity to enter a position with favorable risk-reward dynamics.
Q2: Can the cup with handle pattern occur during a downtrend?
No, this pattern is typically found during an uptrend. It signifies a temporary pause in the stock’s upward movement, allowing it to gather strength before resuming its climb. It is essential to identify the prevailing trend before analyzing the cup with handle pattern.
Q3: Are there any limitations or potential pitfalls when trading the cup with handle pattern?
While this pattern is a reliable indicator, it is not foolproof. Traders should be aware of the following limitations:
- False Breakouts: Sometimes, the stock may break out from the handle but fail to sustain the upward movement, resulting in a false breakout. Traders should wait for confirmation before entering a position.
- Volume Confirmation: Although volume can provide valuable confirmation, it is not always a guarantee of success. Unusual market conditions or external factors may distort volume patterns, leading to false signals.
Q4: Are there any variations of the cup with handle pattern?
Yes, there are variations of this pattern, such as the “cup without handle” or the “inverted cup with handle.” These variations exhibit similar characteristics but may have slightly different interpretations. Traders should familiarize themselves with these variations to expand their trading toolkit.
Q5: Can the cup with handle pattern be applied to different timeframes?
Yes, this pattern can be observed on various timeframes, ranging from daily charts to weekly or monthly charts. However, the significance and reliability of the pattern may vary depending on the timeframe. It is advisable to analyze multiple timeframes to gain a comprehensive view.
Q6: How can I incorporate the cup with handle pattern in my trading strategy?
To incorporate this pattern in your trading strategy, it is crucial to combine it with other technical indicators, such as moving averages, trendlines, or oscillators. This holistic approach helps validate the pattern’s signals and increases the probability of successful trades.
In conclusion, this pattern is a powerful tool for stock traders, providing valuable insights into potential price movements. By understanding its characteristics, identification process, and trading strategies, you can leverage this pattern to make informed decisions and enhance your trading profitability. Remember to combine this pattern with other technical indicators for increased reliability. Happy trading!
Sources
StockCharts: https://stockcharts.com