Reviewed October 3, 2026 · Chart-pattern education
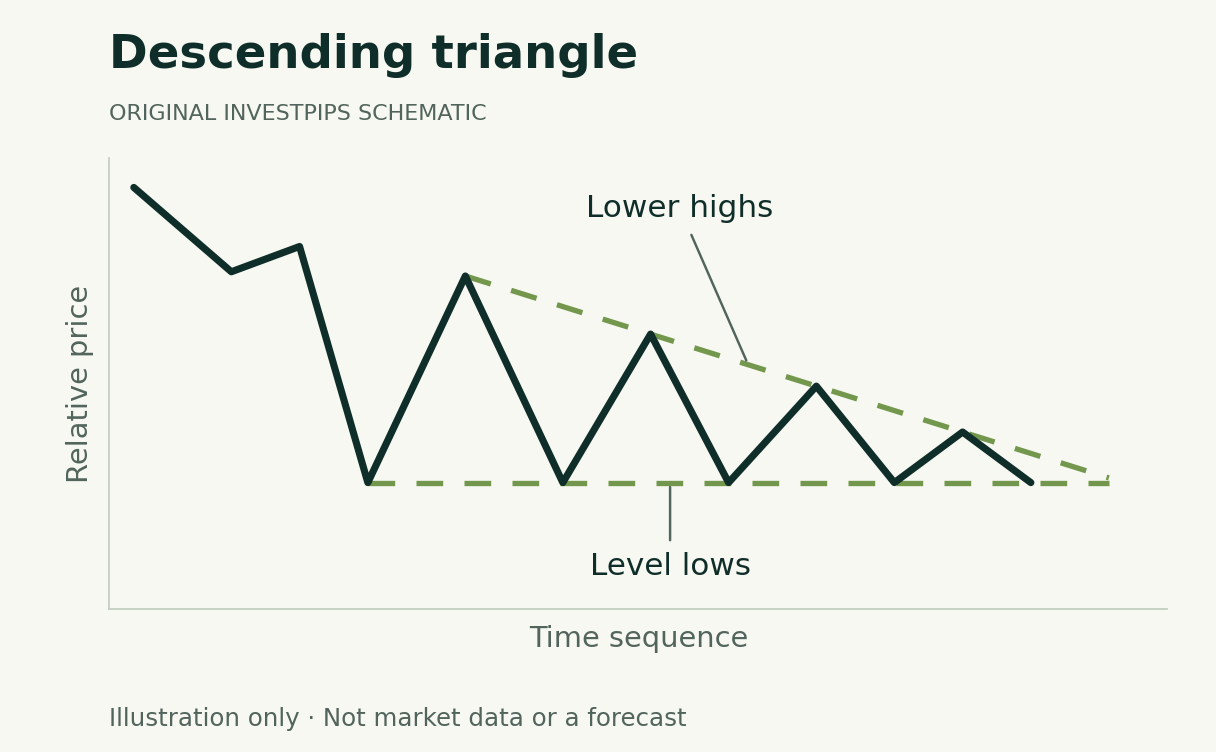
A descending triangle has level lows and lower highs. Keeping those two lines straight is the first step.
This guide corrects a common description error and explains the conventional bearish interpretation without treating it as a profitable strategy.
These lows define the reference support area.
Lower rebound highs narrow the formation.
The lows form support; the highs form the descending side
A descending triangle combines repeated lows near one area with progressively lower reaction highs. StockCharts gives it a conventional bearish interpretation. The pattern is commonly discussed within a decline, but context can also make it a reversal candidate after an advance.
Scroll across the table to see all columns.
| Part | What to observe | Common confusion |
|---|---|---|
| Horizontal support | Several lows near a shared price area. | Lower highs do not form this line. |
| Descending resistance | A sequence of lower rebound highs. | The upper boundary is not horizontal. |
| Narrowing range | The rebound highs move closer to support. | Contraction does not make support unbreakable. |
| Bearish completion | A specified break of the lower area. | A bearish candidate is not already a completed breakdown. |
Define what counts as a support break
Write whether the rule uses an intrabar move, a close below support or another condition. A brief move through a line can reverse before the bar closes. Waiting for a close changes the timing and potential fill; it does not remove failure risk.
A subsequent rebound toward the old support area is a retest. It may not occur. If it does, price can stop near the area or continue back into the range. Neither outcome should be hidden from a study of the rule.
The opposite break remains possible
Price may break above the falling upper boundary instead. That is evidence against the anticipated downside resolution under this definition, not a reason to rename the same example after the fact and count it as a success.
A measured level is different from a trade result
In an invented example, support is $40 and the highest selected reaction is $48. The $8 height, subtracted from the $40 support reference, gives a conventional projected level of $32. It is a charting calculation, not a statement that the security will reach $32.
Scroll across the table to see all columns.
| Quantity | Calculation or assumption |
|---|---|
| Pattern height | $48 − $40 = $8 |
| Downside projection | $40 − $8 = $32 |
| Hypothetical entry reference | $39, if a separate execution rule could achieve it |
| Entry-to-projection distance | $39 − $32 = $7, before costs |
The $8 pattern height is not the $7 distance from the assumed entry. The example specifies no complete strategy and no likelihood of either a favorable or adverse move. It should not be used as a position recommendation.
Short selling introduces separate risks
Observing a bearish pattern does not require selling short. The SEC’s short-sale bulletin explains that short stock positions can incur unlimited losses if price keeps rising. Availability to borrow, borrowing charges and account requirements also matter; a chart cannot verify them.
A planned exit price is not an execution guarantee. Use the research and execution framework to identify the assumptions an actual test would need. The arithmetic in this article is not a validated risk limit.
Distinguish a descending triangle from a falling wedge
A falling wedge has two downward-sloping boundaries. A descending triangle has a roughly level lower area. That flat-versus-falling distinction is more reliable as a description than judging the name by the overall downward appearance.
Record volume and news context as observations with dates. Do not infer that every seller is losing confidence, or that adding another price-based indicator turns the pattern into a quantified forecast. A reproducible test must establish the claimed benefit of an additional filter.
Continue learning
Sources and method
Substantively reviewed October 3, 2026. Diagrams and numerical examples are original, synthetic teaching material. They do not reproduce a security’s trading history, a backtest or a validated strategy. Pattern names describe charting conventions; this article assigns no success probability.
Primary references: StockCharts descending-triangle convention; SEC introduction to short sales.
Advertising is separate from this guide. Read our editorial and advertising standards.
What changed in this update
Corrected the statement that lower highs form horizontal support. Removed unsupported profitability and reliability claims, added original geometry and separated the measured projection from an assumed trade. The original URL and publication date are preserved.
Educational information, not personalized investment advice or a recommendation to trade. A diagram or measured-move projection does not guarantee an outcome.