Reviewed October 3, 2026 · Chart-pattern education
Two lines slope down and converge. The potential bullish interpretation comes from a later break—not from the downward shape itself.
This guide separates the drawing, the preceding trend and the completion condition, using an original schematic rather than a selected market winner.
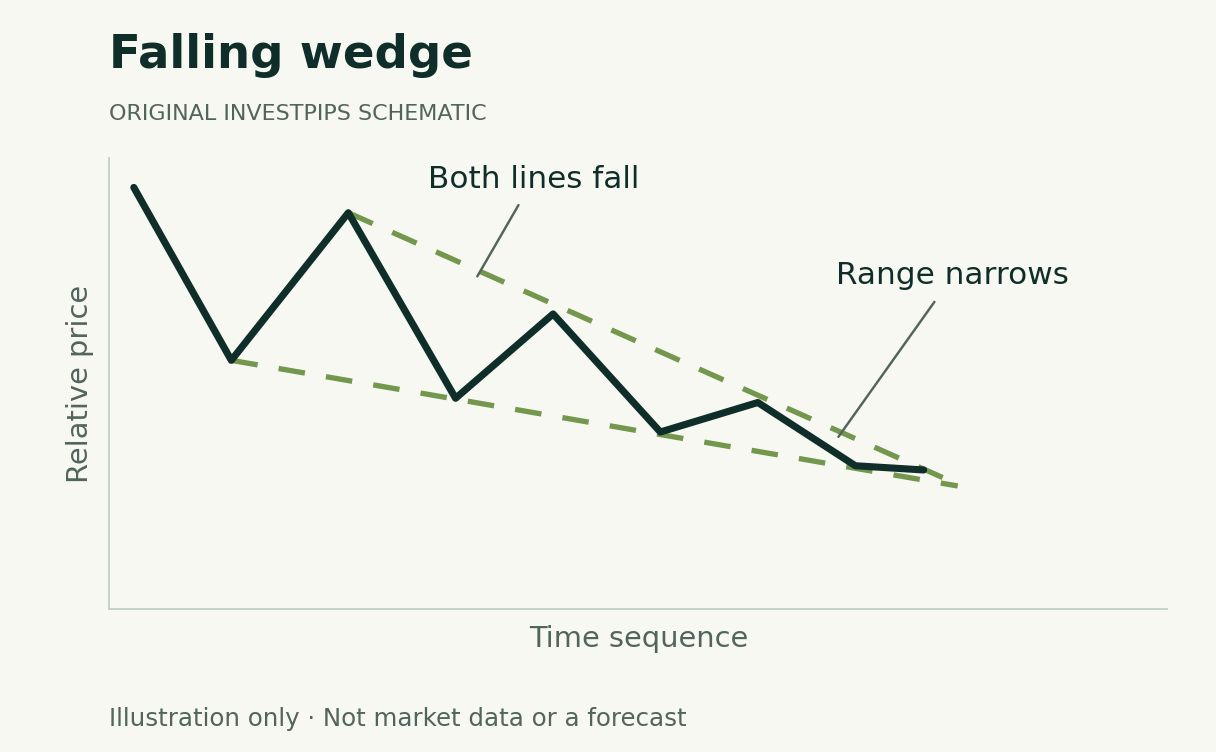
The upper boundary descends faster than the lower.
An upside break can be studied as reversal or continuation.
Both boundaries descend, but the gap narrows
A falling wedge has lower highs and lower lows inside two converging, downward-sloping boundaries. The upper boundary declines more steeply than the lower one. StockCharts associates the formation with a possible bullish resolution after resistance breaks; the falling shape alone is not that break.
Scroll across the table to see all columns.
| Formation | Upper boundary | Lower boundary |
|---|---|---|
| Falling wedge | Falls more steeply. | Falls less steeply; the gap narrows. |
| Descending triangle | Falls. | Approximately level. |
| Falling channel | Falls. | Falls at a similar rate; sides remain roughly parallel. |
Reversal or continuation depends on the preceding trend
After a sustained decline, an upside resolution would be studied as a potential reversal. During a pullback within a larger advance, it could be studied as continuation of that larger advance. The wedge slopes downward in both descriptions.
Specify which time horizon supplies the preceding trend. Do not switch from an intraday trend to a weekly trend after the outcome merely to preserve the label. The difference belongs in the original research record.
Separate narrowing from a change in direction
- Document the lower highs. Record the points and the rule that identifies them.
- Document the lower lows. Confirm that they form a descending boundary, rather than a flat support area.
- Check contraction. The two boundaries should move closer together within the chosen window.
- State the breakout condition. Identify which upper line, bar observation and tolerance define completion.
- Keep the failed cases. A break can reverse, and price can continue falling before any break occurs.
A slower decline is still a decline
Narrowing downward swings do not show that a particular group of buyers has taken control. Until the stated upside condition occurs, the bullish case remains an interpretation of the shape, not an observed reversal.
Do not manufacture precision from the outline
This guide does not assign a universal price target, minimum duration or success percentage to wedges. A drawing tool may display a measured level under its own rules; that does not establish a common rule across tools or a reliable forecast.
If you choose to investigate a target or a volume filter, document it before measuring results. Changing the projection after seeing where price stalled turns the calculation into a description of the outcome rather than a prospective rule.
Scroll across the table to see all columns.
| Record | Reason |
|---|---|
| Chart setup | The interval and scale affect what can be seen. |
| Selected pivots | Another reader needs to reconstruct the boundaries. |
| Completion time | The setup must be knowable before a decision can use it. |
| Opposite or failed move | These cases belong in the sample, too. |
| Execution assumptions | The chart does not establish achievable fills. |
Use the neighboring guides to resolve ambiguity
If the lower area is level, review the descending triangle. If both boundaries rise, review the rising-wedge comparison. If one rises while the other falls, compare the symmetrical triangle.
The testing framework explains how to evaluate a rule after costs. No indicator combination, volume spike or extended formation length is treated here as proof that a trade will succeed.
Continue learning
Sources and method
Substantively reviewed October 3, 2026. Diagrams and numerical examples are original, synthetic teaching material. They do not reproduce a security’s trading history, a backtest or a validated strategy. Pattern names describe charting conventions; this article assigns no success probability.
Primary references: StockCharts falling-wedge explanation.
Advertising is separate from this guide. Read our editorial and advertising standards.
What changed in this update
Removed the unsupported claim that longer wedges produce stronger breakouts. Corrected reversal-versus-continuation context and replaced probability claims with a documented observation process. The original URL and publication date are preserved.
Educational information, not personalized investment advice or a recommendation to trade. A diagram or measured-move projection does not guarantee an outcome.