Reviewed October 3, 2026 · Chart-pattern education
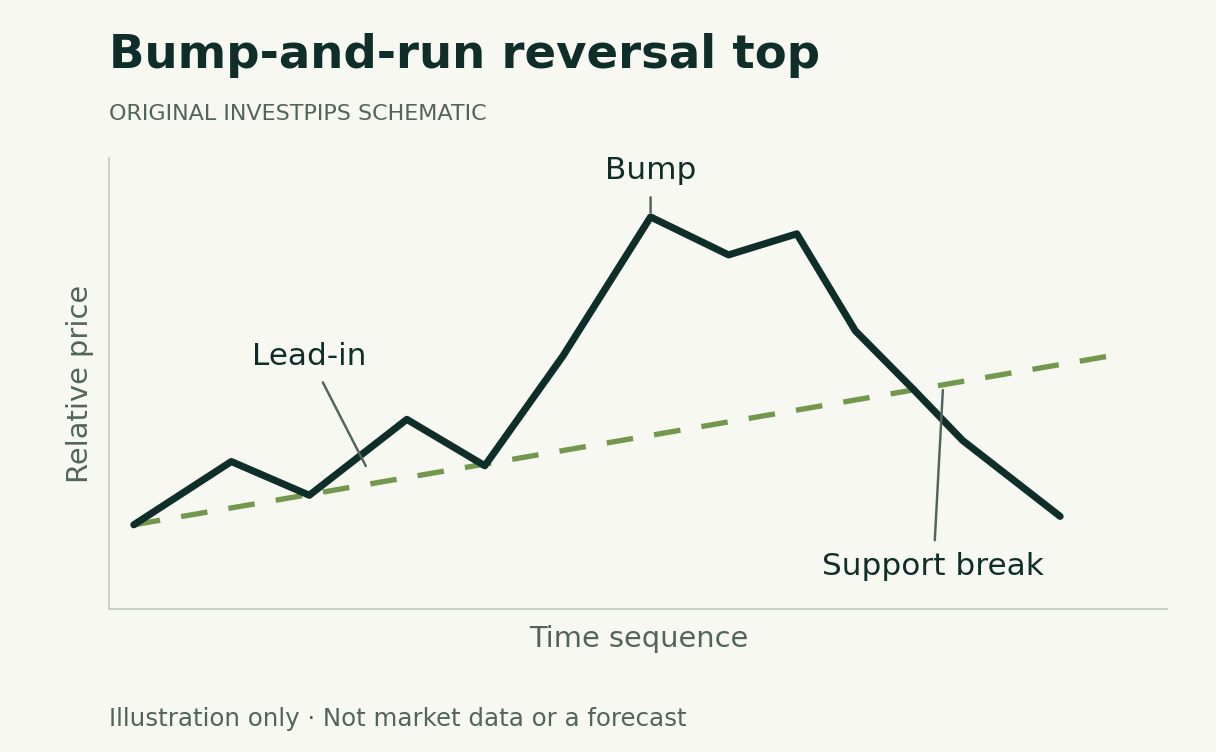
In the top-reversal version, the run is a decline through the original trendline—not another leg upward.
This guide corrects the earlier explanation and uses an original diagram to separate the three stages. It does not claim that a steep advance can be reliably timed or profitably shorted.
Preserve the earlier support line through the bump.
The rollover and break distinguish the top-reversal sequence.
The top version has three stages
The bump-and-run reversal, or BARR, describes an advance that accelerates, rolls over and breaks its earlier support trendline. StockCharts’ account of the pattern developed by Thomas Bulkowski identifies lead-in, bump and run phases. This page covers the top-reversal version, not every pattern with a rapid rise.
Scroll across the table to see all columns.
| Phase | What the schematic shows | What it does not show |
|---|---|---|
| Lead-in | An earlier, more orderly rise from which a support trendline is drawn. | The identity of buyers or a necessary moving-average crossing. |
| Bump | A sharper rise away from that reference line, followed by a rollover. | Proof of the news or motivation behind the acceleration. |
| Run | A decline through the original lead-in line. | A guaranteed decline of a particular size or duration. |
The run in this version is downward
The previous article described the run as another upside breakout and an opportunity to add to an advancing position. That reversed the meaning of the top-reversal sequence being discussed. The reference line is the earlier lead-in support line; the relevant event is a break below it after the bump rolls over.
An accelerating price rise followed by more gains is not evidence of this completed top reversal. A chart may suggest a candidate while the rise is occurring, but the final break is a later event. Keeping those stages separate prevents hindsight from being presented as an early warning that was already certain.
Preserve the lead-in line before the acceleration
- Select the earlier reference points. Record the reaction lows used for the lead-in trendline.
- Keep that line fixed. Do not replace it with the much steeper bump line and still call the later crossing the same event.
- Document the acceleration. Compare price changes over stated intervals rather than relying only on how dramatic the screen looks.
- Define the break. State whether the condition uses a touch, a closing price or another threshold.
- Save alternative outcomes. A candidate that keeps rising or fails to break belongs in the research record.
Screen angles are not portable measurements
The published pattern discussion includes geometric guidelines and notes that visible angles depend on scaling and chart size. Zooming or changing from an arithmetic to a logarithmic price axis can change the appearance. A screenshot’s angle is not a universal physical property of a security.
Use coordinates, not a protractor
A useful research record names the time and price points, scale and line-selection rule. A particular number of screen degrees does not establish the probability of a reversal. The original schematic here intentionally has no market dates or dollar-price calibration.
Treat the pattern as a question about an existing trend
The useful question is whether the earlier trend definition still holds after a sharp acceleration. That can prompt a review of an existing exposure or a research note; it does not require a new short position. A bearish interpretation and a trading instruction are different things.
If studying a trading rule, use the testing framework and include signal availability, failed candidates and realistic costs. No breakout location, protective order or measured shape guarantees an executable exit. This guide assigns no return target to the run.
For a simpler top formation, compare the double-top guide. For narrowing upward boundaries without this three-stage sequence, see the rising-wedge comparison. Similar-looking peaks do not make the underlying definitions interchangeable.
Continue learning
Sources and method
Substantively reviewed October 3, 2026. Diagrams and numerical examples are original, synthetic teaching material. They do not reproduce a security’s trading history, a backtest or a validated strategy. Pattern names describe charting conventions; this article assigns no success probability.
Primary references: StockCharts discussion of Bulkowski’s BARR top.
Advertising is separate from this guide. Read our editorial and advertising standards.
What changed in this update
Corrected the run phase from upside continuation to a break below lead-in support in the top-reversal version. Removed unsupported smart-money claims, a supposed 50-day-average requirement and assertions of profitable continuation. The original URL and publication date are preserved.
Educational information, not personalized investment advice or a recommendation to trade. A diagram or measured-move projection does not guarantee an outcome.