Reviewed October 3, 2026 · Chart-pattern education
Both can contain higher lows. The upper boundary tells you why they are different patterns.
This side-by-side guide compares geometry, conventional interpretation and completion conditions. It does not rank either formation by profitability or claim a validated probability.
The high-side reference area is approximately horizontal.
The lower boundary rises faster, narrowing the formation.
The upper boundary is the first useful distinction
Scroll across the table to see all columns.
| Feature | Ascending triangle | Rising wedge |
|---|---|---|
| Highs | Near a broadly level area. | Progressively higher. |
| Lows | Progressively higher. | Progressively higher. |
| Boundaries | Flat upper line; rising lower line. | Both rise; the lower line catches up with the upper. |
| Conventional interpretation | Bullish candidate. | Bearish candidate. |
| Event associated with completion | Break of upper resistance. | Break of lower support. |
These are conventional descriptions, not guaranteed outcomes. StockCharts’ rising-wedge guide distinguishes its upward-sloping geometry from its bearish interpretation. The direction of the drawn formation and the direction of an anticipated resolution are different ideas.
Ascending triangle: a level ceiling
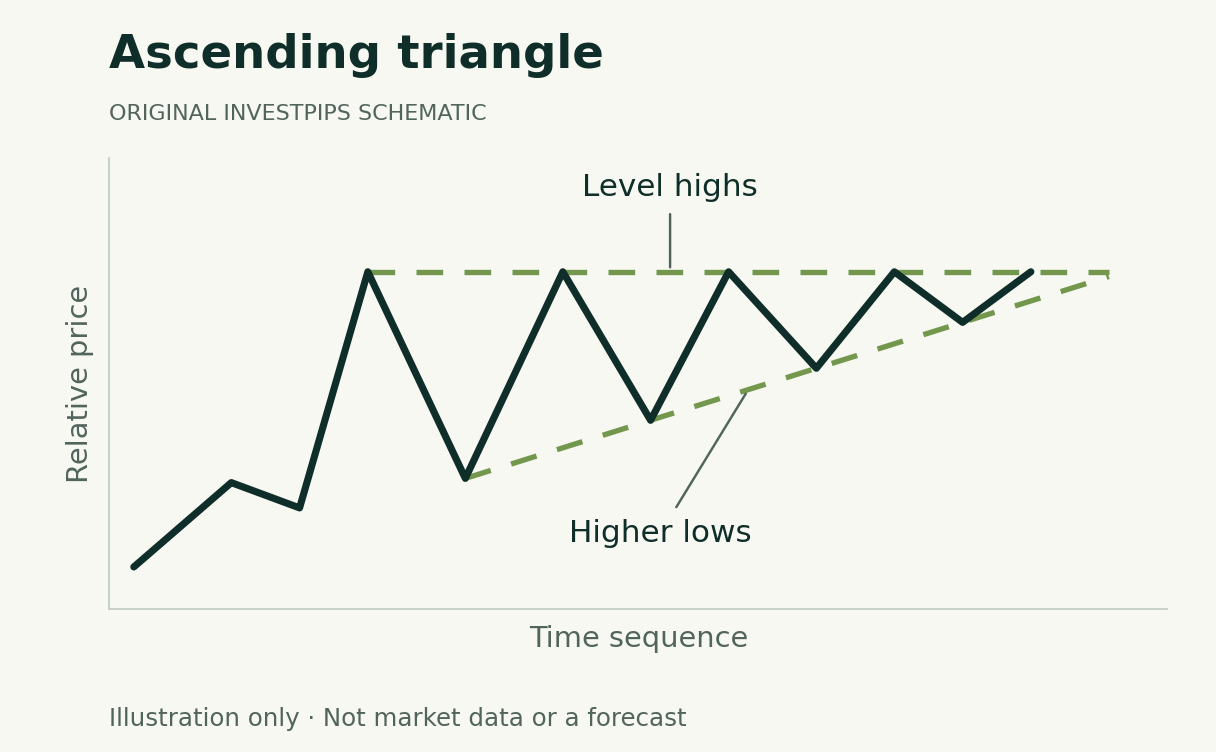
The ascending-triangle guide covers recognition and completion. In a research record, define a tolerance for the near-equal highs. Perfectly horizontal peaks in a schematic are a teaching simplification, not a demand that real observations match to the cent.
Rising wedge: two rising sides that narrow
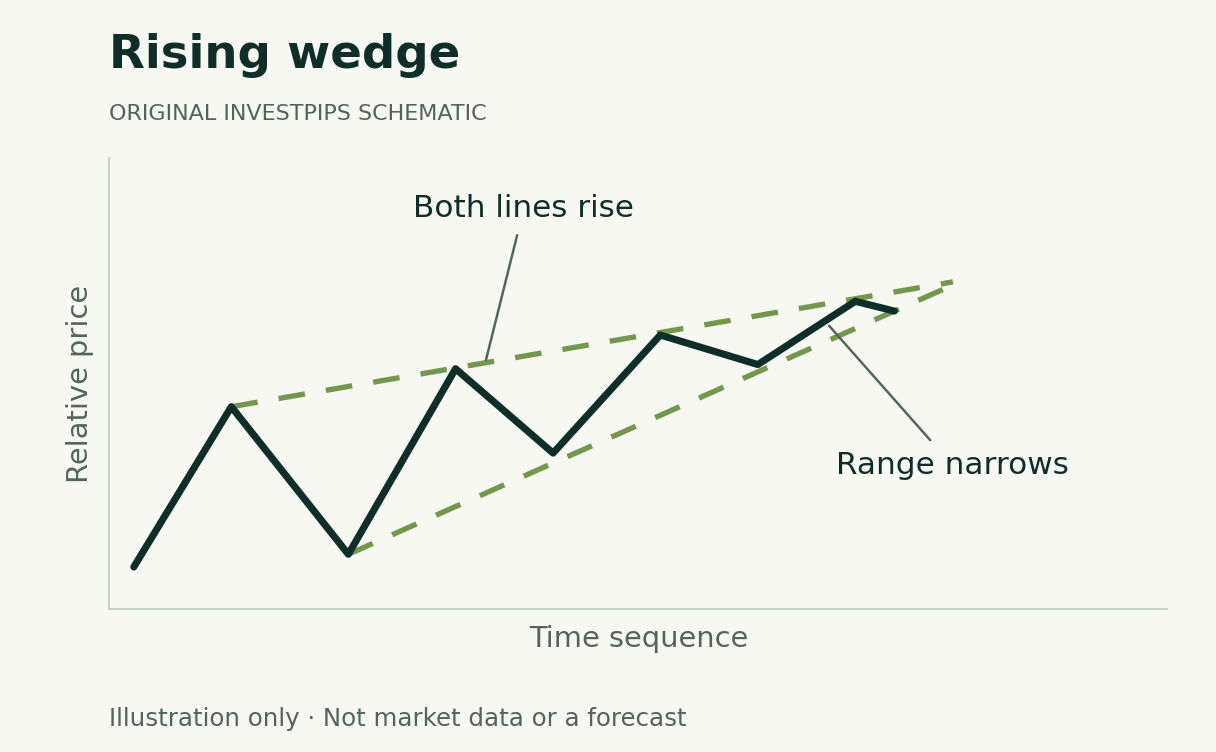
A rising wedge can be discussed as a possible reversal after an advance or as a countertrend pause within a larger decline. In both conventional bearish interpretations, an eventual lower-boundary break matters. Higher highs and higher lows alone do not demonstrate that the anticipated decline has started.
A rising channel has roughly parallel sides; a rising wedge narrows. A symmetrical triangle has its upper and lower boundaries leaning in opposite directions. Avoid treating all three as interchangeable because each contains a zigzag.
When the boundary is not obviously flat
- Use fixed settings. Keep the same time window, chart interval, price input and scale while comparing the candidates.
- Identify the selected highs. A nearly flat line can appear steeper when the chart is resized. Record price and time coordinates, not a screen angle.
- Specify a tolerance. State what counts as approximately level and how much narrowing qualifies under the rule being studied.
- Keep an ambiguous category. A chart that does not clearly fit either definition need not be forced into one.
- Preserve the original drawing. Do not change the label solely because a later outcome makes another pattern look more successful.
Do not recycle one target rule across both shapes
The ascending-triangle case study uses a stated height projection. This comparison does not assign that same formula to every wedge. A platform’s displayed target reflects its own definition; check the method before interpreting the number.
A bearish label does not require a short position
A reader may use a chart to ask whether an existing exposure still fits a plan, or may simply observe it. Short selling is a separate transaction with separate constraints. The SEC’s short-sale bulletin explains that losses on a short stock position can be unlimited as the stock price rises.
The useful next step is a written, testable condition, not a trade based on resemblance. The testing guide covers signal timing and evaluation; the ascending-triangle example separates the drawing from an assumed trade’s arithmetic.
Continue learning
Sources and method
Substantively reviewed October 3, 2026. Diagrams and numerical examples are original, synthetic teaching material. They do not reproduce a security’s trading history, a backtest or a validated strategy. Pattern names describe charting conventions; this article assigns no success probability.
Primary references: StockCharts rising-wedge convention; TradingView triangle geometry; SEC introduction to short sales.
Advertising is separate from this guide. Read our editorial and advertising standards.
What changed in this update
Corrected the treatment of rising wedges as interchangeable bullish continuation setups. Added original comparative diagrams and removed unsupported reliability and uniform target claims. The original URL and publication date are preserved.
Educational information, not personalized investment advice or a recommendation to trade. A diagram or measured-move projection does not guarantee an outcome.