
Welcome to our comprehensive guide on this pattern, a powerful tool used by traders to analyze and predict price movements in financial markets. In this article, we will delve deep into the concept of this pattern, exploring its definition, characteristics, identification techniques, and trading strategies. Whether you are a beginner or an experienced trader, this guide will equip you with the knowledge and expertise to utilize the flag chart pattern effectively in your trading endeavors.
Understanding the Basics
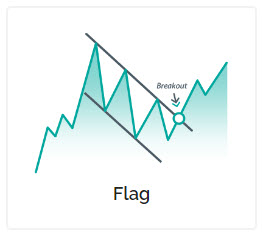
The flag chart pattern is a technical analysis tool used in the field of stock market trading to identify potential price continuation or reversal patterns. It is considered a reliable indicator that helps traders make informed decisions based on the historical price movement of an asset. The pattern resembles a flagpole, followed by a consolidation phase that forms a flag or pennant shape, hence its name.
Characteristics of the Flag Chart Pattern
To effectively identify and interpret the flag chart pattern, it is essential to understand its key characteristics. Here are some noteworthy features of the flag chart pattern:
- Symmetrical Structure: The flag chart pattern exhibits a symmetrical structure, where the price movement resembles a flag or pennant, with parallel trendlines.
- Sharp Initial Move: The pattern begins with a sharp and significant price move, known as the flagpole, which indicates strong buying or selling pressure.
- Consolidation Phase: Following the flagpole, the price enters a consolidation phase, forming a flag or pennant shape. This phase represents a temporary pause in the market trend.
- Volume Analysis: Volume analysis is crucial in flag chart pattern identification. Typically, the volume decreases during the consolidation phase and rises again when the price breaks out of the pattern.
- Duration: The duration of the flag chart pattern can vary, ranging from a few days to several weeks. Traders must monitor the pattern closely to determine its validity.
Using Technical Analysis Tools to Identify the Flag Chart Pattern
Traders employ various technical analysis tools to identify this pattern accurately. Here are some commonly used techniques:
- Trendlines: Drawing trendlines is crucial in identifying this pattern. Connect the highs and lows of the price movement to form parallel lines, creating the flag or pennant shape.
- Volume Analysis: Analyzing the volume during the consolidation phase is essential. A decrease in volume indicates a temporary lull in the market, while a surge in volume signals a potential breakout.
- Measuring Targets: Once this pattern is identified, traders can use the measuring target technique to estimate the potential price move after the breakout. Measure the length of the flagpole and project it from the breakout point.
Trading Strategies for the Flag Chart Pattern
This pattern offers traders numerous trading opportunities. Here are some popular strategies used by traders to capitalize on this pattern:
- Breakout Strategy: Traders wait for a confirmed breakout from the flag pattern and enter a trade in the direction of the breakout. Stop-loss orders are placed below the breakout point to manage risk.
- Pullback Strategy: In this strategy, traders wait for a pullback to the breakout level before entering a trade. The pullback provides a favorable risk-reward ratio and increases the probability of a successful trade.
- Flag Continuation Pattern: When this pattern occurs within an established trend, traders interpret it as a continuation pattern. They enter trades in the direction of the prevailing trend, expecting the trend to resume.
- Flag Reversal Pattern: In some cases, this pattern can act as a reversal pattern. Traders identify key reversal indicators, such as candlestick patterns or trendline breaks, to enter trades against the prevailing trend.
FAQs about the Flag Chart Pattern
- What is the significance of volume in flag chart pattern analysis?
- Volume provides crucial insights into the strength and validity of this pattern. Traders look for decreasing volume during the consolidation phase and increasing volume during the breakout, confirming the pattern’s reliability.
- How long does the flag chart pattern typically last?
- The duration of this pattern can vary significantly. It can last anywhere from a few days to several weeks, depending on the market conditions and the timeframe being analyzed.
- Can the flag chart pattern act as a standalone trading strategy?
- While this pattern is a powerful tool for identifying potential price movements, it is recommended to combine it with other technical analysis tools and indicators for a comprehensive trading strategy.
- Are there variations of the flag chart pattern?
- Yes, variations of this chart pattern exist, such as the bullish flag and the bearish flag. These variations have similar characteristics but occur within different market contexts.
- What are some common pitfalls to avoid when trading the flag chart pattern?
- Traders should avoid entering trades based solely on this pattern without confirming indicators. It is crucial to consider other factors, such as overall market conditions, news events, and technical indicators, to make well-informed trading decisions.
- Is the flag chart pattern applicable to all financial markets?
- Yes, this pattern can be applied to various financial markets, including stocks, currencies, commodities, and cryptocurrencies. Its principles remain the same across different asset classes.
Wrap-Up
This chart pattern is a valuable tool for traders seeking to identify potential price continuation or reversal patterns. By understanding its characteristics, employing proper identification techniques, and implementing effective trading strategies, traders can enhance their decision-making process and increase their chances of success in the financial markets. Remember to combine this chart pattern with other technical analysis tools and indicators to validate trade signals and mitigate risks.