Reviewed October 3, 2026 · Chart-pattern education
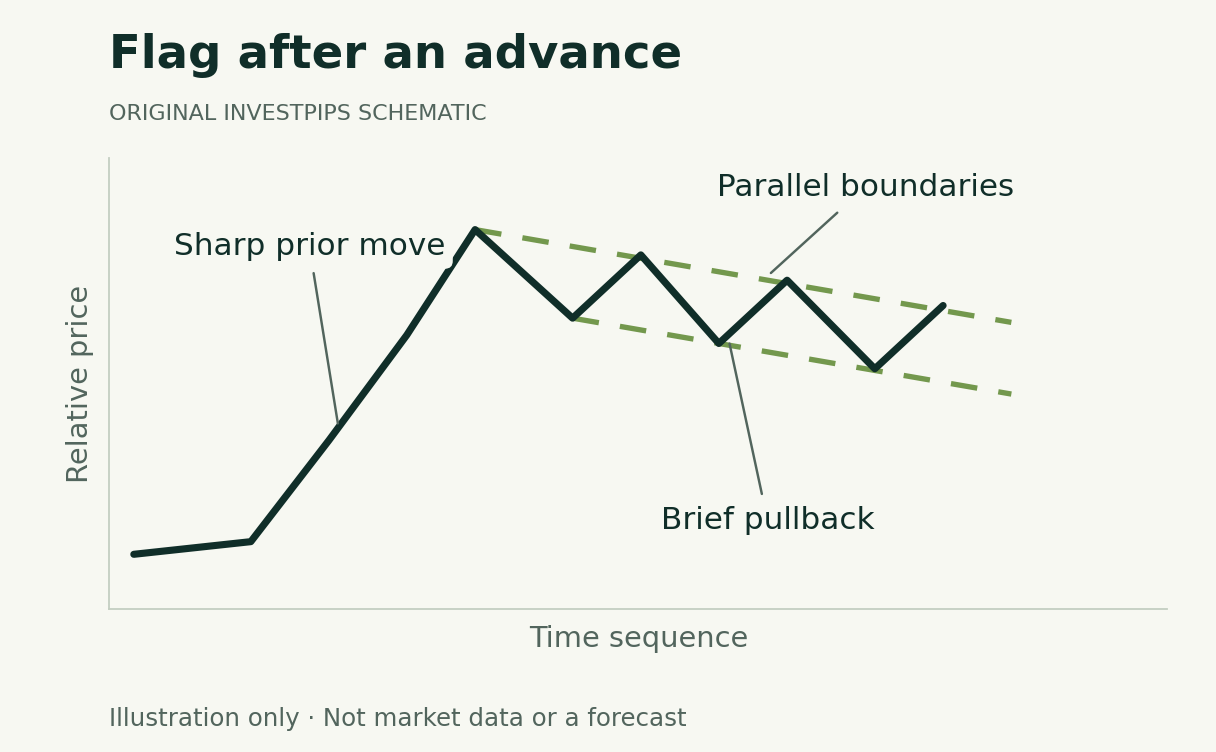
A flag is a brief channel after a sharp move. The pause does not guarantee another move in the same direction.
This guide focuses on the pole, roughly parallel boundaries and a stated continuation condition. It uses invented geometry and numbers rather than a selected historical winner.
The initial move is part of the definition.
A converging pause is examined separately as a pennant.
A flag has a pole and a roughly parallel pause
The conventional flag follows a sharp price move with a compact consolidation between roughly parallel boundaries, often leaning against the preceding move. StockCharts distinguishes this channel-like flag from a converging pennant. The names should not be swapped simply because both follow a pole.
Scroll across the table to see all columns.
| Element | After an advance | After a decline |
|---|---|---|
| Pole | A sharp upward move. | A sharp downward move. |
| Flag | A compact pause, often sloping downward. | A compact pause, often sloping upward. |
| Continuation hypothesis | An upside resolution. | A downside resolution. |
| Unresolved risk | The pause can deepen or break the other way. | The pause can turn into a recovery. |
The pole matters as much as the small channel
A drifting range without a preceding sharp move does not satisfy the same flag definition. Specify the pole’s endpoints and what counts as sharp relative to the instrument and timeframe. A daily-chart description cannot be copied into an intraday test without defining the new inputs.
The boundaries need not be perfectly parallel to the pixel, but a study must state its tolerance. If the two sides visibly converge, compare the pennant guide. If the consolidation becomes much longer than the initial rule permits, retain that as a changed or expired candidate rather than quietly extending the rule.
Projecting the pole requires a reference point
Consider an invented advance from $100 to $110, followed by a flag. Assume the selected upside-break reference is $108. Under a convention that adds pole length to that reference, the projection is $118. The example uses the breakout reference, not the pole’s original $110 high.
Scroll across the table to see all columns.
| Step | Calculation |
|---|---|
| Pole length | $110 − $100 = $10 |
| Selected breakout reference | $108 |
| Projected level | $108 + $10 = $118 |
| If an independent rule assumed a $109 entry | $118 − $109 = $9 to the projection, before costs |
Projection conventions can differ. State the one used before comparing results. A $10 pole is not automatically a $10 achievable gain, and a plotted objective does not provide a time horizon or a success probability.
Do not rename a failed continuation to preserve a win
Under the selected definition, a break against the pole is a different outcome from continuation with it. A subsequent reversal pattern might develop, but calling the original failure a successful “flag reversal strategy” after the event does not validate the earlier rule.
Waiting for a retest changes the strategy
A return to the broken boundary may never happen. It may also continue through the area. A retest entry and a first-break entry have different timing and fills; neither is established here as more profitable.
A short checklist for studying flags
- Record the pole. Keep its start, end, size and observation window.
- Define the channel. State boundary tolerance and permitted consolidation length.
- Specify completion. Distinguish an intrabar crossing from a completed-bar condition.
- Keep failures. Include opposite breaks and unresolved candidates.
- Evaluate implementation. Combine the shape with stated entry, sizing, exit and cost rules.
For a shared framework, read continuation patterns. For testing details and execution limits, use the research guide. Adding volume or another indicator is an additional rule to investigate, not a certificate of accuracy.
Continue learning
Sources and method
Substantively reviewed October 3, 2026. Diagrams and numerical examples are original, synthetic teaching material. They do not reproduce a security’s trading history, a backtest or a validated strategy. Pattern names describe charting conventions; this article assigns no success probability.
Primary references: StockCharts flag and pennant conventions.
Advertising is separate from this guide. Read our editorial and advertising standards.
What changed in this update
Separated flags from pennants, removed unsupported claims of reliable outcomes and superior retest entries, and replaced after-the-fact reversal claims with explicit failure handling. The original URL and publication date are preserved.
Educational information, not personalized investment advice or a recommendation to trade. A diagram or measured-move projection does not guarantee an outcome.