Reviewed October 3, 2026 · Chart-pattern education
Level highs and rising lows describe the setup. A future rise is still an open question.
This is the recognition guide for ascending triangles on ordinary price charts. For numbers, entry assumptions and loss scenarios, continue to the separate worked example.
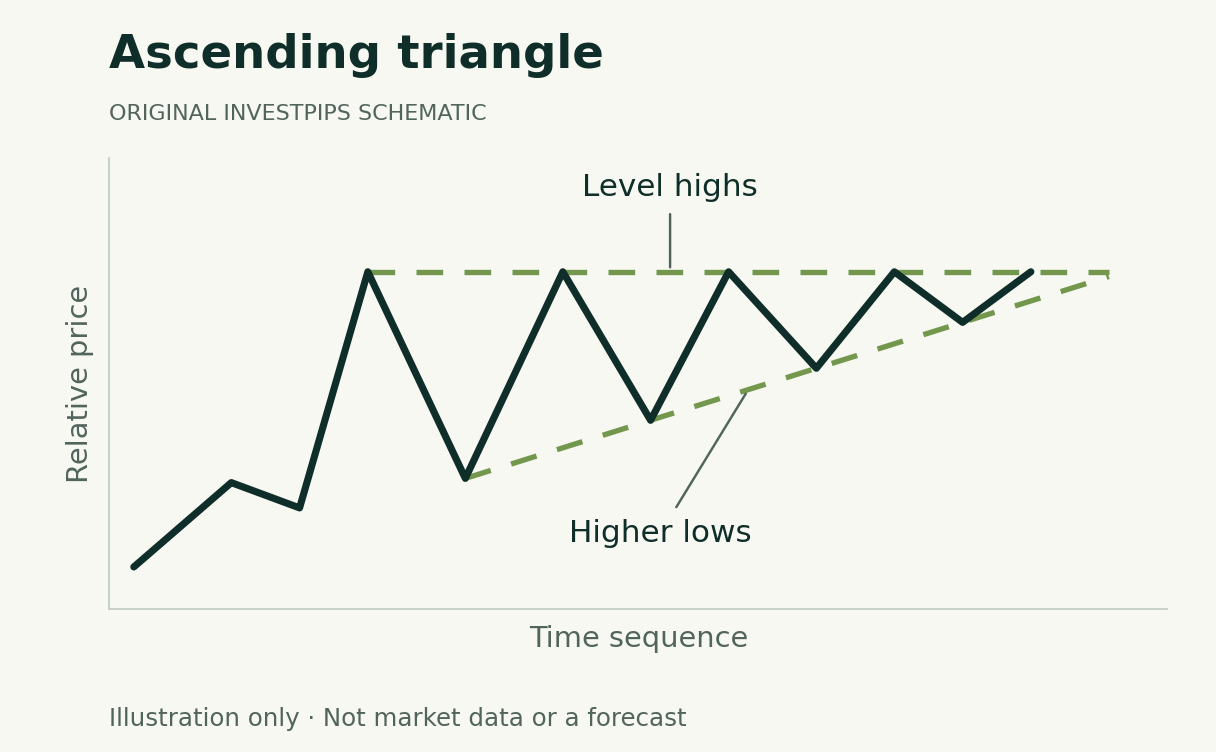
Repeated highs define the reference resistance area.
Higher reaction lows narrow the range.
Recognize the two different boundaries
The conventional ascending triangle has repeated highs near a common area and rising reaction lows. StockCharts describes a bullish interpretation, commonly in an uptrend, but a bullish classification is not a guarantee that resistance will break.
Scroll across the table to see all columns.
| Element | Observation | Limit |
|---|---|---|
| Upper boundary | Several highs cluster near a broadly level area. | A reference area is not a physical ceiling. |
| Lower boundary | Selected reaction lows rise over time. | That does not identify who is buying or why. |
| Prior trend | The preceding move supplies context. | An ascending triangle is not restricted to one historical outcome. |
| Completion rule | A stated move or close beyond the selected upper boundary. | The completed signal can still fail afterward. |
Draw first; interpret second
TradingView’s drawing-tool documentation describes placing points on alternating highs and lows. A drawing is a selected representation of the data; different point choices can produce different boundaries.
- Fix the chart setup. Record bar interval, session, price input and scale. Use the same settings when comparing examples.
- Mark the repeated highs. Explain how close they must be to count as a common resistance area. Do not require exact equality unless that is the rule being studied.
- Mark the rising lows. Connect meaningful, separated reactions. A line through arbitrary points is not evidence of a formation.
- Freeze the candidate. Save the chart before the next prices appear. Note what would invalidate the drawing.
A break, a retest and a failure are different events
A rule might require a completed bar above resistance, rather than an intrabar touch. That reduces one kind of ambiguity but also changes the observation time. It is a specification choice, not proof that the strategy performs better.
A later return toward the breakout level is a retest. It is optional price behavior, not a step the market owes the observer. A close above resistance followed by a move back inside the range can be recorded as a failed breakout under a stated rule.
The downside still exists
Price can fall through the rising lower boundary before an upside break, or decline after an apparent upside breakout. Draw the failure condition before looking at later prices. A bullish label does not remove either possibility.
What the height calculation does—and does not—do
One conventional projection adds the pattern’s widest vertical height to the resistance-break level. It is a measured-move convention, not a probability estimate or a valuation. An assumed entry may be above that boundary, so the distance from entry to the projection can be smaller than the pattern height.
The worked ascending-triangle case study walks through the arithmetic and a gap-loss scenario. This definition page does not recommend an entry, stop distance or account allocation.
Check the nearest look-alikes
In a symmetrical triangle, the upper boundary slopes down. In a rising wedge, both boundaries slope up and converge. The high-side boundary is therefore the fastest place to start the comparison.
Volume, moving averages and other observations can be recorded alongside the shape. Their agreement does not, by itself, establish independent evidence or quantify a success rate. Use the pattern-testing guide to define and evaluate any additional filter.
Continue learning
Work through the numbers · Compare the rising wedge · Browse the pattern library
Sources and method
Substantively reviewed October 3, 2026. Diagrams and numerical examples are original, synthetic teaching material. They do not reproduce a security’s trading history, a backtest or a validated strategy. Pattern names describe charting conventions; this article assigns no success probability.
Primary references: StockCharts ascending-triangle convention; TradingView triangle drawing tool.
Advertising is separate from this guide. Read our editorial and advertising standards.
What changed in this update
Removed unsupported real-world examples and claims of reliable profits or improved accuracy. Focused this page on recognition and linked the separate numerical case study. The original URL and publication date are preserved.
Educational information, not personalized investment advice or a recommendation to trade. A diagram or measured-move projection does not guarantee an outcome.