Reviewed October 3, 2026 · Chart-pattern education
Three lows can define a candidate. The resistance break and the eventual outcome remain separate events.
This guide builds on the corrected triple-bottom explanation with an original diagram, structured comparisons and the existing synthetic example. It does not claim that more tests of a low create a better trading edge.
Comparable levels matter more than perfect equality.
The selected resistance area defines the completion question.
Three separated lows still need a resistance break
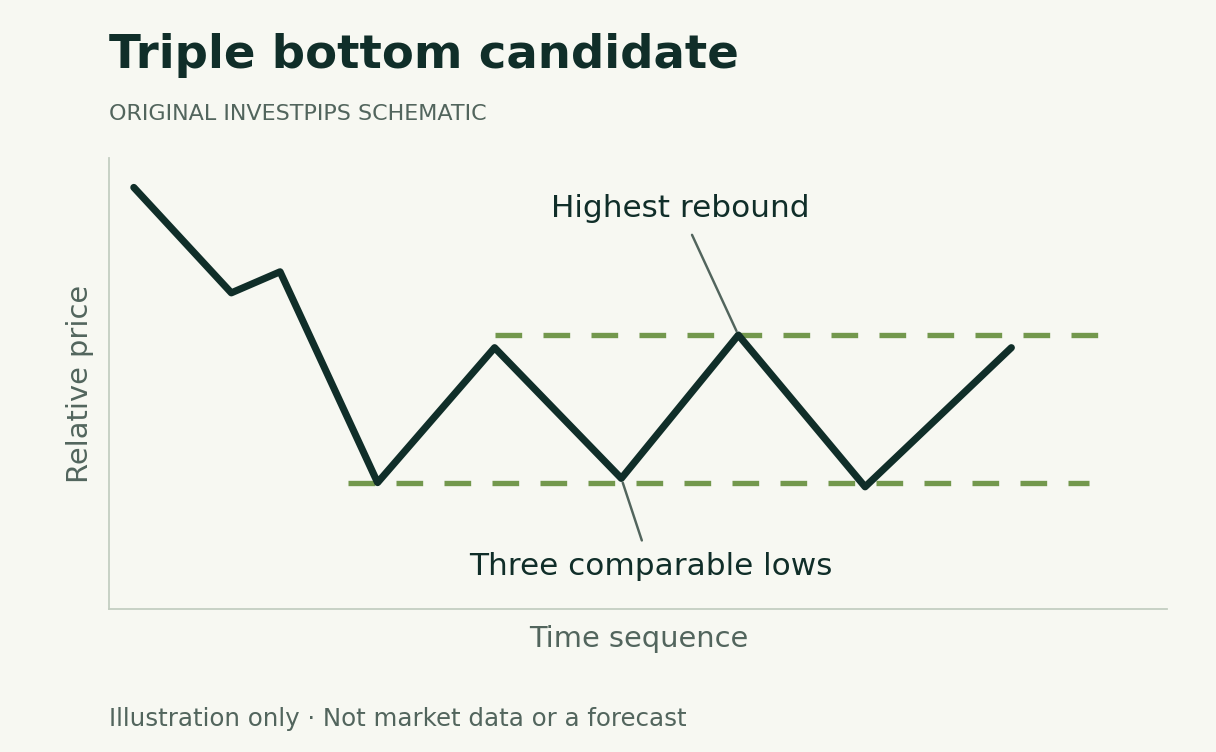
A triple-bottom candidate follows a decline and contains three lows around a similar area. StockCharts identifies the highest intervening rebound as the conventional resistance reference. An upside break completes that definition; three lows alone do not establish the next price move.
Scroll across the table to see all columns.
| Part | What to record |
|---|---|
| Prior decline | The time horizon and observations defining the preceding trend. |
| Three lows | Their prices, spacing and the tolerance for being comparable. |
| Intervening rebounds | The highest rebound used as the resistance reference. |
| Completion event | The exact crossing or closing rule and when it becomes knowable. |
The lows need not be identical. They should be meaningfully separated under a stated definition rather than three adjacent price ticks. Similar lows can also occur in other ranges; count the rebound structure as well as the tests of support.
Work through the original synthetic example
Imagine a fictional share declining from $70, reaching lows near $50 three times and rebounding no higher than $56 between them. A later move above $56 would meet the breakout element of this simplified example. The diagram illustrates the structure only, not this exact dollar series.
Scroll across the table to see all columns.
| Quantity | Calculation | Meaning |
|---|---|---|
| Pattern height | $56 − $50 = $6 | The selected vertical range. |
| Measured objective | $56 + $6 = $62 | A conventional projected level, not a promise. |
| Assumed entry and adverse exit | $57 and $49 | Two separate execution assumptions. |
| Planned difference for 25 shares | ($57 − $49) × 25 = $200 | Before costs; actual loss can be greater. |
The assumed entry-to-objective distance is $62 − $57 = $5, while the assumed adverse distance is $8. A bullish-looking diagram therefore does not automatically supply favorable trade arithmetic. The example is not a recommended entry, stop or quantity.
More tests do not establish greater reliability
- Continued range. The rebound high may remain unbroken.
- Another decline. Price may fall through the repeated low area.
- False breakout. An upside break can be followed by a return into the formation.
- Changing labels. A candidate double bottom may become a triple bottom only after more data arrive. Preserve the earlier record instead of rewriting it.
- Execution differences. A chart level does not demonstrate that an order filled there.
The extra low is not a success-rate calculation
A third test adds another observation to the drawing. It does not independently prove that the next breakout is more reliable than a double bottom. That comparison would require defined rules and a suitable sample.
The planned exit is still an assumption
A hypothetical $49 exit cannot enforce a $200 loss limit in the example. A gap, thin liquidity or an unfilled order can change the outcome. The research and execution guide explains stop-order limits and the difference between a trigger and a fill.
To study the pattern, record it before the subsequent move and include unsuccessful cases. Document signal timing, costs and the evaluation period. This article provides no backtest or measured success percentage.
Compare related formations without mixing chart types
The double-bottom guide uses two lows; the descending-triangle guide also considers how the rebound highs change. A repeated support area alone does not decide which description best fits the rest of the chart.
These are ordinary price-chart definitions. Similarly named point-and-figure patterns use different construction rules and should not inherit this article’s interpretation merely because the names overlap.
Continue learning
Sources and method
Substantively reviewed October 3, 2026. Diagrams and numerical examples are original, synthetic teaching material. They do not reproduce a security’s trading history, a backtest or a validated strategy. Pattern names describe charting conventions; this article assigns no success probability.
Primary references: StockCharts triple-bottom convention.
Advertising is separate from this guide. Read our editorial and advertising standards.
What changed in this update
Retained the previously corrected explanation and synthetic arithmetic, added an original diagram and brought the page into the shared editorial layout. Clarified the difference between pattern height and entry-to-objective distance. The original URL and publication date are preserved.
Educational information, not personalized investment advice or a recommendation to trade. A diagram or measured-move projection does not guarantee an outcome.