A pennant chart pattern formation showing convergence of trendlines and consolidation before a breakout.

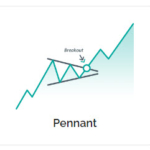
Pennant Chart Pattern: A Guide for Traders

Welcome to this comprehensive guide on the pennant chart pattern, a popular and powerful technical analysis tool used by traders. In this article, we will dive deep into understanding the intricacies of the pennant chart pattern, its formation, interpretation, and application in trading strategies. Whether you are a novice trader or an experienced professional, this […]

Read More   
Image depicting the ascending triangle chart pattern in a stock market graph.

What Is Ascending Triangle Pattern: Unraveling Its Secrets for Successful Trading

In the world of technical analysis, patterns play a crucial role in predicting price movements and identifying potential trading opportunities. One such pattern that has gained significant popularity among traders is the ascending triangle pattern. This article aims to delve into the intricacies of the ascending triangle pattern, exploring its definition, formation, trading strategies, and […]

Read More   
A focused trader sitting at a desk with a notepad and pen, surrounded by financial books and charts. The trader is diligently documenting trading strategies and RSI signals, displaying a deep sense of concentration and dedication to their craft.

How to use the RSI indicator in Trading

The Relative Strength Index (RSI) is a valuable tool for assessing the momentum of price movements in trading. It operates on a scale from zero to 100, indicating the speed and extent of price changes. Developed by J. Welles Wilder, the RSI provides insights into overbought and oversold conditions, where readings above 70 suggest overbought […]

Read More   
An awe-inspiring oil painting depicting the concept of crypto investing, portraying a group of adventurers navigating through a dense jungle filled with towering trees and ancient ruins, with rays of golden sunlight piercing through the foliage, symbolizing the potential rewards and risks of this financial journey, capturing a sense of mystery and exploration, painted with thick brushstrokes and vibrant colors on a large canvas

Crypto Investing Tips: A Comprehensive Guide to Maximizing Your Investments

Investing in cryptocurrencies can be an exciting and potentially lucrative venture. However, the volatile nature of the crypto market means that it can also be highly risky. To navigate this digital landscape successfully, it’s essential to equip yourself with the right knowledge and strategies. In this comprehensive guide, we’ll explore valuable crypto investing tips that […]

Read More   
A striking visualization of the best penny stocks for 2023 as towering skyscrapers, each representing a different stock, piercing through a foggy cityscape, symbolizing the uncertainty and potential rewards of the stock market, Sculpture, metal sculptures with intricate details.

Best Penny Stocks 2023: Hidden Gems in the Stock Market

Welcome to our comprehensive guide on the best penny stocks of 2023! In this article, we will dive deep into the world of penny stocks, uncovering hidden gems and shedding light on potential investment opportunities. With expert analysis and meticulous research, we aim to provide you with valuable insights to make informed decisions and navigate […]

Read More   
Illustration showcasing the different types of moving averages for analyzing market trends

Types of Moving Averages: A Comprehensive Guide to Understanding and Utilizing Different Moving Averages

Unlock the power of moving averages to analyze and predict market trends Embracing the Power of Moving Averages Moving averages are indispensable tools in the field of technical analysis. They enable traders and investors to identify trends, filter out market noise, and make well-informed decisions. By calculating averages over a specific period, moving averages smooth […]

Read More