Reviewed October 3, 2026 · Chart-pattern education
The compact triangle is only half the definition. A pennant also needs the sharp move that comes before it.
This guide separates pennants from similar shapes and shows how a pole-length projection depends on its reference point. It does not assign a success rate to shorter formations.
The pole distinguishes the setup from an isolated small triangle.
The pause contracts rather than remaining parallel-sided.
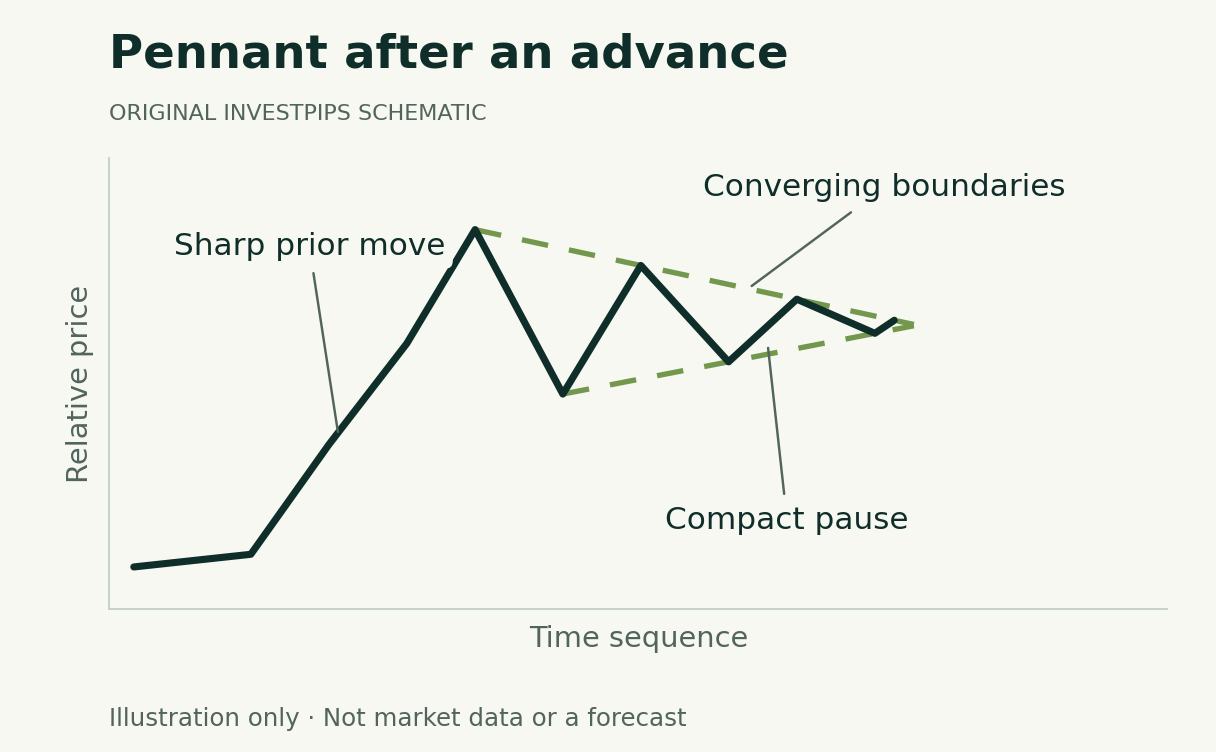
A compact triangle after a sharp pole
A pennant candidate has a pronounced preceding move followed by a small consolidation whose boundaries converge. The pole provides context; the contracting outline provides the pennant. Fidelity’s chart-pattern material discusses this sharp-move-and-pause sequence for flags and pennants.
Scroll across the table to see all columns.
| Formation | Boundary geometry | Context that matters |
|---|---|---|
| Pennant | Converging compact pause. | A sharp preceding pole. |
| Flag | Roughly parallel pause. | A sharp preceding pole. |
| Symmetrical triangle | Falling upper and rising lower boundaries. | A broader contracting range; not necessarily the same immediate pole. |
A pennant is not simply another name for every flag or symmetrical triangle. Boundaries, relative duration and the preceding move belong in the definition. Do not use the eventual outcome to decide retrospectively which name would have worked best.
The prior move defines the continuation hypothesis
After an advance, the conventional bullish case looks for an upside resolution. After a decline, the conventional bearish case looks for a downside resolution. Those are hypotheses about the next move. An opposite break or continued sideways trading remains possible.
A close beyond a boundary, a distance filter and an intrabar crossing are different completion rules. Choose one before looking at subsequent bars. High volume may be recorded as another condition, but does not guarantee that a break will persist.
An invented bearish projection
Assume a fictional decline from $80 to $68 creates a $12 pole. A compact pennant follows, and the selected downside-break reference is $69. Under a pole-length projection from that reference, the illustrative level is $57.
Scroll across the table to see all columns.
| Step | Calculation |
|---|---|
| Pole magnitude | $80 − $68 = $12 |
| Break reference | $69 |
| Projected level | $69 − $12 = $57 |
| If a separate rule assumed a $68 entry | $68 − $57 = $11 to the projection, before costs |
The bullish diagram and bearish dollar scenario are separate teaching illustrations. Neither supplies a tradable symbol, a verified fill or an expected return. StockCharts describes a pole-length projection from the relevant break; the chosen reference must be recorded to make the arithmetic reproducible.
A brief formation is not automatically a better one
The previous article claimed that shorter pennants were more reliable. Duration by itself cannot establish a success rate without a specified market, definition and sample. A compact pause is part of the description; profitability is a separate empirical question.
- Missing pole. A small triangle without the specified preceding move may not qualify.
- Extended consolidation. The formation can outlast the original observation window. Record that outcome rather than repeatedly extending it.
- Opposite break. Price can move against the continuation hypothesis.
- False break. The completion rule can trigger and the price can reverse afterward.
- Fill differences. A rapid move may leave no opportunity to execute at the plotted reference price.
Measure the evidence, not the confidence of the label
A scanner’s detection or a visually neat drawing is a classification. To claim an advantage, evaluate a complete strategy with realistic timing, costs and failed candidates. This page contains no such performance test.
Use the comparison before deciding how to study it
If the sides are parallel, compare the flag guide. If the immediate pole is absent or the range is broader, compare the symmetrical triangle. The continuation guide explains how prior trend and resolution fit together.
A bearish research example is not a recommendation to sell short. That transaction introduces separate borrowing and loss risks. Use the testing framework to specify the instrument, transaction, timing and execution assumptions before measuring any results.
Continue learning
Sources and method
Substantively reviewed October 3, 2026. Diagrams and numerical examples are original, synthetic teaching material. They do not reproduce a security’s trading history, a backtest or a validated strategy. Pattern names describe charting conventions; this article assigns no success probability.
Primary references: Fidelity: Identifying Chart Patterns; StockCharts flag and pennant conventions.
Advertising is separate from this guide. Read our editorial and advertising standards.
What changed in this update
Corrected the claim that pennant, flag and symmetrical triangle are interchangeable names. Removed unsupported duration-versus-reliability claims and added original diagrams, arithmetic and failure cases. The original URL and publication date are preserved.
Educational information, not personalized investment advice or a recommendation to trade. A diagram or measured-move projection does not guarantee an outcome.