Reviewed October 3, 2026 · Chart-pattern education
A pause in a trend can resolve in either direction. The shape helps organize the question; it does not supply the answer.
This guide explains the continuation idea shared by several chart patterns. It focuses on context and sequence, with links to individual definitions and worked examples.
State the instrument, interval and preceding move.
A candidate formation is not a completed continuation.
Continuation depends on what came before
A price range cannot continue a trend that has not been identified. Record the preceding direction and the interval used to identify it. A pause on a daily chart may contain several shorter trends on an intraday chart; those are different observations rather than a contradiction.
StockCharts groups patterns by conventional continuation and reversal interpretations while noting that context can change the classification. The label describes the hypothesis. The subsequent price action determines whether the observed move actually continued.
Compare the structure of the pause
Scroll across the table to see all columns.
| Formation | What to look at | What the label does not establish |
|---|---|---|
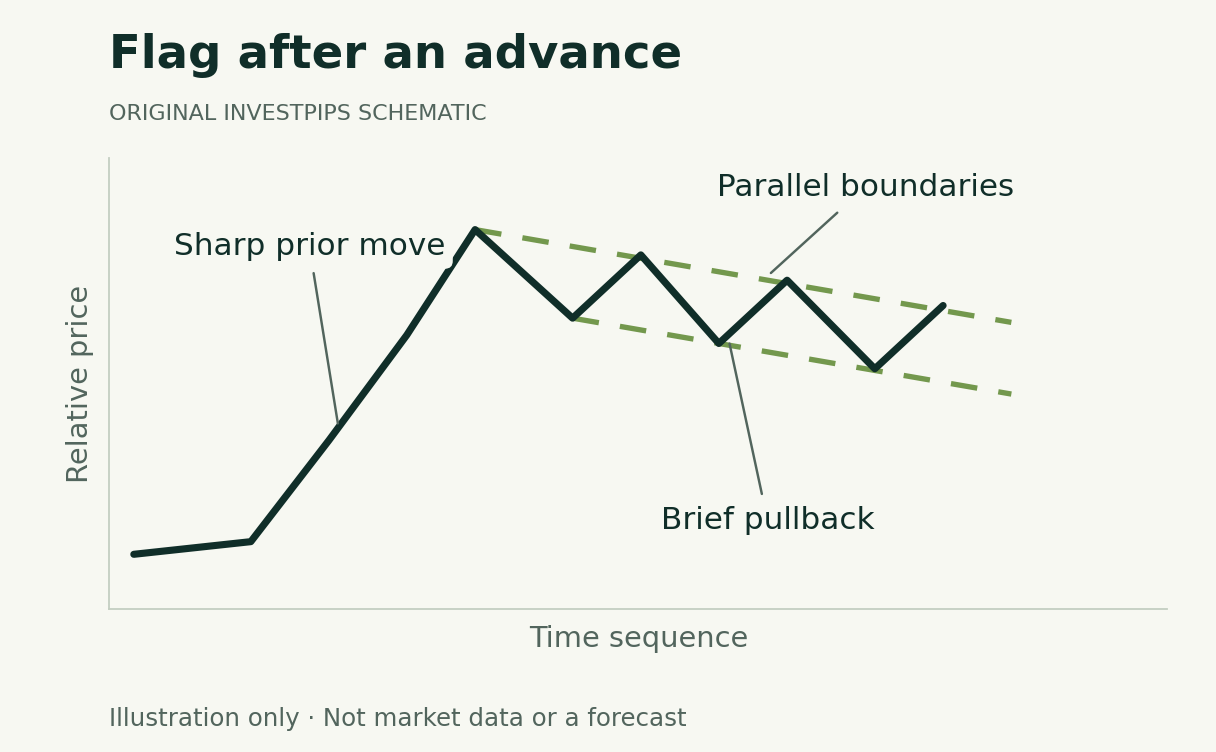
| Flag | A sharp move followed by a compact channel with roughly parallel sides. | That a later breakout will follow the pole. |
| Pennant | A sharp move followed by a compact, converging pause. | That every small triangle is a pennant. |
| Triangle | The direction of the upper and lower boundaries and the prior trend. | A universally predictable breakout direction. |
| Rectangle | A range between broadly level upper and lower areas. | That repeated support or resistance will keep holding. |
| Wedge | Two converging lines sloping in the same direction. | That rising geometry is bullish or falling geometry bearish. |
Follow the sequence instead of naming the ending early
- Observe the prior move. Define its start, end and size. Flags and pennants need a meaningful pole under the chosen definition.
- Mark the consolidation. Preserve the original boundaries and explain any tolerance. Do not keep redrawing them to fit each new price.
- Set a completion rule. For example, a specified bar close beyond a selected boundary. This is a research choice, not a universally optimal rule.
- Classify what happens next. A break with the prior trend, a break against it and continued sideways trading are different outcomes.
- Track the aftermath. A completed breakout can still reverse. Decide in advance how a test treats that event.
Volume and retests are observations, not promises
Fidelity’s chart-pattern teaching material discusses the sharp move and short consolidation in flags and pennants. A volume comparison should state the market, session and comparison window. “High volume” without a baseline is not a reproducible condition.
A retest is a later return toward a broken boundary. It may never occur, and a return can continue through the area. A test that waits for a retest is a different strategy from one that enters on the first break; neither is established here as superior.
Continuation is an outcome, too
A setup can be called a continuation candidate before it resolves. Saying that a trend actually continued requires later observations. Keep the candidate label separate from the result when building a research sample.
Choose a guide by the boundary shape
Use the flag guide for parallel consolidation, the pennant guide for a compact triangle after a pole, and the symmetrical-triangle guide for a broader contracting range. If both sides tilt together, compare the rising-wedge explanation with the falling-wedge guide.
No minimum duration or chart interval is validated here as the most profitable. Rules expressed in daily bars cannot be transferred to five-minute bars merely by keeping the same number. The time available for execution, costs and sample composition also change.
Before treating any of these descriptions as a strategy, write an entry and exit rule and use the testing framework. A measured-move illustration describes arithmetic, not an expected return.
Continue learning
Sources and method
Substantively reviewed October 3, 2026. Diagrams and numerical examples are original, synthetic teaching material. They do not reproduce a security’s trading history, a backtest or a validated strategy. Pattern names describe charting conventions; this article assigns no success probability.
Primary references: StockCharts pattern classifications; Fidelity: Identifying Chart Patterns.
Advertising is separate from this guide. Read our editorial and advertising standards.
What changed in this update
Removed blanket statements that consolidation must resolve with the preceding trend and that adding indicators automatically improves outcomes. Gave this page a distinct role as the continuation framework. The original URL and publication date are preserved.
Educational information, not personalized investment advice or a recommendation to trade. A diagram or measured-move projection does not guarantee an outcome.