
In the world of technical analysis, chart patterns play a vital role in predicting price movements and identifying potential trading opportunities. One such pattern that traders frequently encounter is the symmetrical triangle pattern. This article delves into the symmetrical triangle pattern, discussing its characteristics, target projections, trading strategies, and breakout signals. Whether you are a novice trader or an experienced investor, understanding this pattern can enhance your ability to make informed trading decisions. So, let’s explore the symmetrical triangle pattern and unlock its secrets!
What is a Symmetrical Triangle Pattern?
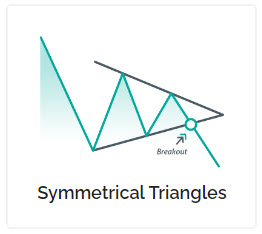
A symmetrical triangle pattern is a continuation pattern that occurs when the price consolidates within converging trendlines, forming a triangle-like shape. The upper trendline connects the series of lower highs, while the lower trendline joins the sequence of higher lows. The pattern signifies a period of indecision in the market, as buyers and sellers battle for control. As the price compresses within the triangle, it creates a coiling effect, building up energy for a potential breakout.
Characteristics of a Symmetrical Triangle Pattern
To effectively recognize and trade the symmetrical triangle pattern, it is crucial to understand its key characteristics. Here are some notable features of this pattern:
- Converging Trendlines: The symmetrical triangle pattern is defined by two converging trendlines, indicating decreasing volatility as the price range narrows.
- Similar Slopes: The upper and lower trendlines of the triangle pattern should have approximately the same slope, displaying equilibrium between buyers and sellers.
- Decreasing Volume: As the price consolidates within the triangle, the trading volume tends to diminish. This decline in volume reflects the indecisiveness among market participants.
- Breakout Anticipation: Traders closely monitor the symmetrical triangle pattern for a breakout, which occurs when the price breaches either the upper or lower trendline.
Target Projections of the Symmetrical Triangle Pattern
Determining the price target after a breakout is an essential aspect of trading the symmetrical triangle pattern. Traders often employ the following method to estimate the potential price movement:
- Measuring the Height: Measure the vertical distance between the highest and lowest points of the triangle pattern.
- Breakout Confirmation: Wait for a confirmed breakout before applying the height measurement.
- Projection Calculation: Add the height measurement to the breakout point for an upward breakout or subtract it for a downward breakout.
By employing this technique, traders can set realistic target projections, aiding them in determining potential profit levels and managing risk-reward ratios effectively.
Trading the Symmetrical Triangle Pattern
Trading the symmetrical triangle pattern requires a comprehensive strategy that combines technical analysis, risk management, and market psychology. Here are a few popular approaches to consider when trading this pattern:
1. Breakout Trading Strategy
Breakout trading involves entering a trade when the price breaks out of the symmetrical triangle pattern. Traders can use the following guidelines for executing a breakout strategy:
- Confirmation: Wait for a confirmed breakout, where the price convincingly closes above or below the trendline.
- Entry Point: Enter the trade after the breakout, aiming to capture the initial momentum.
- Stop Loss: Place a stop-loss order below the breakout point to limit potential losses if the breakout fails.
- Target Projection: Calculate the target projection based on the height of the pattern, as discussed earlier.
- Risk Management: Implement proper risk management techniques, such as setting a favorable risk-reward ratio and trailing stop-loss orders.
2. Pullback Trading Strategy
Alternatively, traders can adopt a pullback strategy, which involves entering a trade during a price retracement after the breakout. The following steps outline this approach:
- Identify Breakout: Wait for a breakout and subsequent retracement back to the trendline.
- Confirmation: Confirm that the price respects the trendline during the pullback phase, indicating potential support or resistance.
- Entry Point: Enter the trade during the pullback, aiming to capitalize on the renewed momentum.
- Stop Loss: Place a stop-loss order below the recent swing low for long trades or above the swing high for short trades.
- Target Projection: Apply the target projection technique discussed earlier to set profit targets.
3. Volume Analysis
Analyzing trading volume can provide valuable insights when trading this pattern. Here’s how volume analysis can complement your trading strategy:
- Volume Confirmation: Look for an increase in trading volume during the breakout, indicating strong buying or selling pressure.
- Divergence Signals: Observe volume divergences between the consolidation phase and the breakout, which may suggest the presence of smart money entering or exiting the market.
- Volume Patterns: Analyze volume patterns, such as volume spikes or drying up of volume, to gain a better understanding of market sentiment.
By incorporating volume analysis into your symmetrical triangle trading strategy, you can make more informed decisions and improve your overall trading performance.
Frequently Asked Questions (FAQs)
Q1: How can I identify a symmetrical triangle pattern on a price chart?
A1: To identify this pattern, look for converging trendlines with similar slopes and decreasing volatility. The upper trendline connects lower highs, while the lower trendline joins higher lows.
Q2: Is the symmetrical triangle pattern reliable for predicting future price movements?
A2: This pattern is considered a reliable continuation pattern. However, it is essential to wait for a confirmed breakout before relying on the pattern for price predictions.
Q3: Can the symmetrical triangle pattern result in false breakouts?
A3: Yes, false breakouts can occur in this pattern, where the price briefly breaks out of the pattern but fails to sustain the move. Traders should use proper risk management techniques, such as stop-loss orders, to mitigate potential losses.
Q4: Are there variations of the symmetrical triangle pattern?
A4: Yes, there are variations of this pattern, such as the ascending triangle and descending triangle, which have different slope characteristics. Each variation signifies a distinct market sentiment.
Q5: How long does the symmetrical triangle pattern typically last?
A5: The duration of this pattern can vary. However, it is generally advisable to wait for at least two to three touches on each trendline before considering the pattern valid.
Q6: Can the symmetrical triangle pattern be applied to different timeframes?
A6: Yes, this pattern can be observed on various timeframes, ranging from intraday charts to weekly or monthly charts. However, the significance and reliability of the pattern may vary depending on the timeframe.
Wrap-Up
The symmetrical triangle pattern is a valuable tool in a trader’s arsenal for identifying potential trading opportunities. By understanding its characteristics, target projections, and trading strategies, traders can enhance their ability to make informed decisions in the market. Whether you choose to employ breakout or pullback strategies, incorporating proper risk management techniques and analyzing volume patterns can significantly improve your trading outcomes. So, next time you come across a symmetrical triangle pattern, remember to analyze it diligently and seize the potential trading opportunities it presents.
Sources
- Investopedia: A comprehensive financial education website.