
In the fast-paced world of trading and investing, understanding market patterns and trends is key to success. One such pattern that has captured the attention of traders and analysts is the falling wedge chart pattern. This article aims to provide a comprehensive guide to this chart pattern, covering its definition, formation, identification, and potential trading strategies. Whether you are a seasoned trader or just starting, this article will equip you with the knowledge to unlock the secrets of this chart pattern.
Falling Wedge Chart Pattern: Explained
What is it?
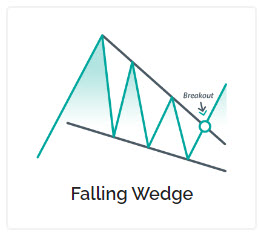
This chart pattern is a bullish continuation pattern that occurs within an existing uptrend. It is characterized by converging trend lines, with both the support line and the resistance line sloping downward. This pattern suggests that despite the short-term downward movement, the overall trend is likely to reverse and continue its upward trajectory.
Identifying a Falling Wedge Chart Pattern
To identify a this chart pattern, traders look for specific criteria:
- Converging Trend Lines: The pattern is formed by two trend lines. The support line connects the lower swing lows, while the resistance line connects the lower swing highs. These lines should slope downward and converge.
- Volume Analysis: Volume plays a crucial role in confirming this chart pattern. Typically, trading volume decreases as the pattern develops, indicating a decrease in selling pressure.
- Duration: Falling wedge patterns usually develop over several weeks or months. The longer the pattern forms, the stronger the potential breakout.
Interpretation of
The falling wedge chart pattern provides valuable insights into the market sentiment. As the pattern develops, sellers are gradually losing momentum, causing the price to consolidate within a narrower range. This consolidation often indicates that buyers are stepping in, leading to the potential for a bullish breakout.
Trading Strategies
Now that we have a good understanding of the falling wedge chart pattern, let’s explore some trading strategies that traders commonly use when encountering this pattern:
1. Breakout Strategy
Once the falling wedge chart pattern is identified, traders can prepare for a potential breakout. A breakout occurs when the price breaks above the upper resistance line. This event signals the end of the pattern and a potential continuation of the prior uptrend. Traders can enter long positions, placing stop-loss orders below the breakout point to manage risk.
2. Pullback Strategy
In some cases, after the breakout, the price may retest the upper resistance line, which now acts as a support level. Traders can take advantage of this pullback to enter long positions with a better risk-reward ratio. The stop-loss orders can be placed below the retest level.
3. Volume Confirmation Strategy
To increase the probability of a successful trade, traders often look for volume confirmation. Ideally, during the breakout, there should be a significant increase in trading volume, indicating strong buying interest. High volume acts as validation for the breakout and can help traders make more informed decisions.
Frequently Asked Questions (FAQs)
1. What is the purpose of a falling wedge chart pattern?
This chart pattern serves as a bullish continuation pattern within an existing uptrend. It provides traders with insights into potential market reversals and continuation of the trend.
2. Can the falling wedge chart pattern occur in a downtrend?
No, this chart pattern is typically observed within an existing uptrend. It represents a temporary pause or consolidation before the uptrend continues.
3. Are there any risks associated with trading the falling wedge chart pattern?
Like any trading strategy, there are inherent risks involved. Traders should always practice proper risk management techniques and use stop-loss orders to protect against potential losses.
4. How do I improve my ability to identify the falling wedge chart pattern?
Experience and practice play a crucial role in improving pattern recognition skills. Regularly studying price charts and utilizing technical analysis tools can enhance your ability to identify this chart pattern accurately.
5. Can the falling wedge chart pattern be used in conjunction with other technical indicators?
Yes, traders often combine this chart pattern with other technical indicators such as moving averages, oscillators, or trend lines to further validate their trading decisions.
6. What markets and timeframes are suitable for trading the falling wedge chart pattern?
This chart pattern can be applied to various markets, including stocks, forex, and commodities. Traders can utilize different timeframes, ranging from intraday to longer-term charts, depending on their trading style and objectives.
Wrap-Up
This chart pattern is a valuable tool in a trader’s arsenal. By understanding its formation, identification, and potential trading strategies, traders can make more informed decisions and increase their chances of success. Remember, like any trading pattern, the falling wedge chart pattern should be used in conjunction with other technical analysis tools and risk management strategies. Continuously enhance your skills through practice and experience to unlock the secrets of the market.
Sources