Reviewed October 3, 2026 · Chart-pattern education
A narrowing range describes what price has done. It does not choose the next direction.
This guide focuses on symmetrical triangles in ordinary price charts, using an original schematic and separate hypothetical upside and downside calculations.
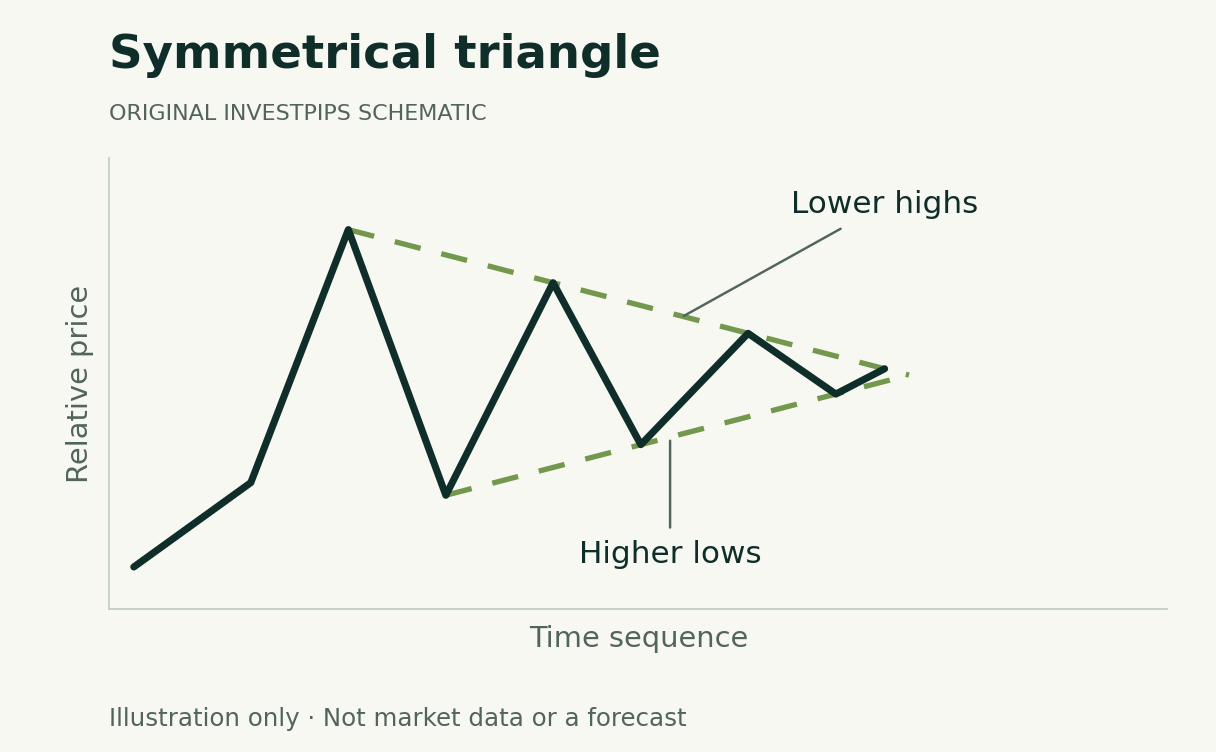
The selected high points slope downward.
The selected low points slope upward.
Two boundaries converge from opposite directions
A symmetrical triangle connects a sequence of lower reaction highs with a sequence of higher reaction lows. StockCharts treats it as a contracting formation whose eventual breakout can resolve in either direction. The word “symmetrical” does not turn that uncertainty into a 50/50 probability estimate.
Scroll across the table to see all columns.
| Observation | What it describes | What it does not establish |
|---|---|---|
| Falling upper boundary | Successive selected highs are lower. | That a downside break must follow. |
| Rising lower boundary | Successive selected lows are higher. | That an upside break must follow. |
| Narrowing range | The selected boundaries approach one another. | A stored quantity of energy or a guaranteed large move. |
| Prior trend | The context for a continuation hypothesis. | That a reversal is impossible. |
Choose a completion rule before the outcome
A researcher might require a completed bar beyond a boundary, a minimum distance beyond it, or another explicitly stated rule. Those choices create different samples. A momentary crossing and a completed close are not the same observation.
Two opposite outcomes should remain possible in the record until the rule resolves. Price can also remain indecisive or make a break that reverses. Do not keep moving the boundaries to preserve the original interpretation after every new bar.
Project from the specified breakout reference
Consider an invented triangle with a $6 initial height. Under a height-projection convention, an upside break referenced at $50 gives $56; a downside break referenced at $47 gives $41. These are separate hypothetical outcomes, not two orders for the same assumed trade.
Scroll across the table to see all columns.
| Scenario | Calculation | Interpretation |
|---|---|---|
| Upside example | $50 + $6 = $56 | A conventional projected level, not an expected return. |
| Downside example | $47 − $6 = $41 | A separate assumed resolution, not a price guarantee. |
The entry price, if any, can differ from the reference boundary. Therefore the distance from entry to the projection is not automatically $6. A target calculation also says nothing about the probability of reaching it before another exit condition.
A pennant adds a different context
A pennant is a compact contracting pause after a sharp pole. A broader symmetrical triangle does not require that same immediate pole. Keep the observation window and relative duration in the definition rather than treating every small triangle as a pennant.
An ascending triangle has a broadly flat upper boundary; a descending triangle has a broadly flat lower one. Both sides of a falling wedge tilt downward. These distinctions concern the drawing before any outcome is known.
A neat apex is not a deadline
The point where extended lines meet is a geometric intersection. It does not schedule an order, guarantee volatility or oblige the market to break in a particular direction. Record what actually happens.
Keep the uncertain cases in the sample
- Freeze the definition. Record the selected pivots, boundaries, time window and tolerance.
- Record timing. A pivot that needs later bars cannot be used before those bars exist.
- Include failed breaks. Define failure without selecting the rule after seeing the outcome.
- Evaluate the whole strategy. Include sizing, exits and execution costs rather than scoring only the drawing.
Continue learning
Sources and method
Substantively reviewed October 3, 2026. Diagrams and numerical examples are original, synthetic teaching material. They do not reproduce a security’s trading history, a backtest or a validated strategy. Pattern names describe charting conventions; this article assigns no success probability.
Primary references: StockCharts symmetrical-triangle explanation; TradingView triangle methodology.
Advertising is separate from this guide. Read our editorial and advertising standards.
What changed in this update
Removed claims that the shape guarantees continuation or stores predictive energy. Clarified direction uncertainty, projected-level arithmetic and the distinction from a pennant. The original URL and publication date are preserved.
Educational information, not personalized investment advice or a recommendation to trade. A diagram or measured-move projection does not guarantee an outcome.