
To learn stock chart patterns and their comprehensive details, simply click on the desired chart pattern below.
Are you interested in delving into the world of stock trading? Do you want to understand the intricacies of the market and make informed investment decisions? If so, learning stock chart patterns is an essential skill to acquire. Stock chart patterns provide valuable insights into market trends and can help you predict future price movements. In this comprehensive guide, we will explore the fascinating world of stock chart patterns, their significance, and how you can master the art of technical analysis to boost your trading success.
Table of contents
Understanding Stock Chart Patterns
To grasp the concept of stock chart patterns, let’s start with a basic understanding of technical analysis. Technical analysis involves studying historical price and volume data to make predictions about future market movements. Stock chart patterns are graphical representations of price movements over time, offering visual cues about potential reversals or continuations in the market.
By learning to interpret these patterns, traders can make more informed decisions about when to buy, sell, or hold stocks. Stock chart patterns can help identify potential entry and exit points, manage risk, and improve overall trading performance.
Types of Stock Chart Patterns
There are numerous stock chart patterns, each with its own unique characteristics and implications. Let’s explore some of the most common patterns that traders encounter:
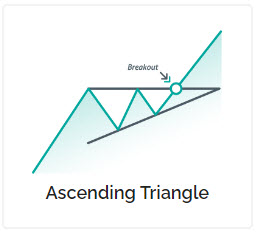
Ascending Triangle
The ascending triangle pattern is a bullish continuation pattern characterized by a horizontal resistance level and an upward sloping trendline. This pattern indicates that buyers are becoming increasingly dominant, potentially leading to a breakout to the upside.
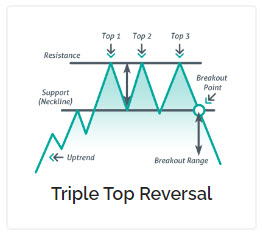
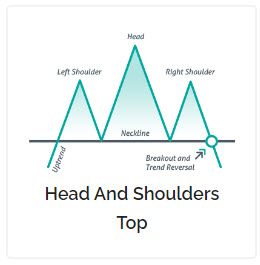
Head and Shoulders
The head and shoulders pattern is a reliable reversal pattern that signals a potential trend reversal from bullish to bearish. It consists of three peaks, with the middle peak (the head) being higher than the other two (the shoulders).
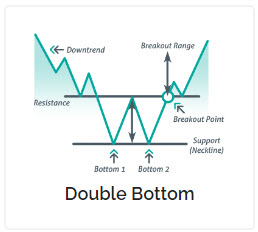
Double Bottom
The double bottom pattern is a bullish reversal pattern that forms after a downtrend. It consists of two consecutive troughs, with the second trough exceeding the first. This pattern suggests a potential trend reversal to the upside.
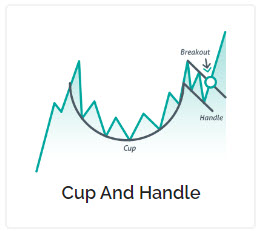
Cup and Handle
The cup and handle pattern is a bullish continuation pattern often found in longer-term charts. It resembles a cup with a handle and signifies a temporary pause before the stock continues its upward trajectory.
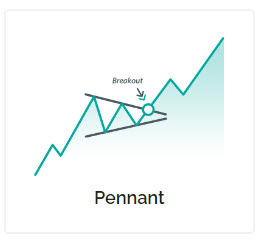
Pennant
The pennant pattern is a short-term continuation pattern that resembles a small symmetrical triangle. It occurs after a significant price move and indicates that the market is catching its breath before resuming the previous trend.
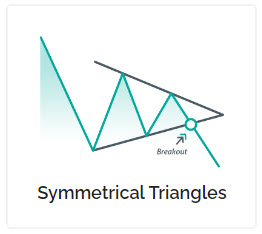
Symmetrical Triangle
The symmetrical triangle pattern is a consolidation pattern characterized by a series of lower highs and higher lows. It signifies a period of indecision in the market and often precedes a significant breakout.
And many more…
These are just a few examples of the wide range of stock chart patterns that traders encounter. Each pattern has its own unique implications and can provide valuable insights into market dynamics.
How to Identify Stock Chart Patterns
Identifying stock chart patterns requires practice and familiarity with the various patterns. Here are some steps to help you get started:
- Study and Research: Familiarize yourself with different stock chart patterns by studying educational resources, books, and reputable websites. Understand the construction and significance of each pattern.
- Use Charting Software: Utilize charting software or online platforms that provide technical analysis tools. These tools often include pattern recognition features that can automatically identify and highlight chart patterns.
- Analyze Historical Data: Analyze historical price charts to spot patterns in real-world examples. Look for recurring patterns and study their behavior in different market conditions.
- Combine with Indicators: Consider combining the identification of stock chart patterns with other technical indicators such as moving averages, volume, or oscillators. This can provide additional confirmation and increase the accuracy of your analysis.
Remember, practice makes perfect. The more you study and analyze stock chart patterns, the better you will become at identifying them accurately.
Key Principles of Technical Analysis
To effectively analyze stock chart patterns, it’s essential to understand some key principles of technical analysis. These principles can help you interpret patterns and make more informed trading decisions:
- Trend Identification: Determine the prevailing trend in the market, whether it’s bullish (upward), bearish (downward), or sideways. Stock chart patterns can provide insights into potential trend reversals or continuations.
- Support and Resistance Levels: Identify significant support (price floor) and resistance (price ceiling) levels on the chart. These levels can help you identify potential entry and exit points and manage risk.
- Volume Analysis: Analyze trading volume alongside chart patterns to gauge the strength of price movements. High volume during a breakout or reversal can provide confirmation of the pattern.
- Confirmation with Other Indicators: Use additional technical indicators such as moving averages, relative strength index (RSI), or MACD to confirm the validity of a pattern. Multiple indicators aligning can increase the probability of a successful trade.
By applying these principles, you can enhance your technical analysis skills and make more informed trading decisions.
Common Mistakes to Avoid
As you embark on your journey to learn stock chart patterns, it’s important to be aware of common mistakes that traders often make. Avoiding these pitfalls can help you refine your analysis and achieve better results:
- Overlooking Confirmation Signals: Relying solely on stock chart patterns without considering confirmation signals can lead to false signals. Always use additional technical indicators or fundamental analysis to support your decision-making process.
- Ignoring Risk Management: Failing to implement proper risk management techniques can lead to significant losses. Set stop-loss orders and define your risk tolerance before entering a trade.
- Chasing Patterns: Trying to force a pattern where it doesn’t exist can cloud your judgment and lead to poor trading decisions. Be patient and wait for clear and well-defined patterns to emerge.
- Neglecting Fundamental Analysis: While stock chart patterns provide valuable insights, they should be complemented with fundamental analysis. Consider factors such as company earnings, industry trends, and economic indicators to gain a holistic view of the stock’s potential.
By avoiding these common mistakes, you can refine your analysis and improve your trading outcomes.
Benefits of Learning Stock Chart Patterns
Mastering the art of technical analysis and stock chart patterns offers numerous benefits for traders:
- Improved Market Timing: By identifying potential entry and exit points, stock chart patterns can help you time your trades more effectively, maximizing profits and minimizing losses.
- Enhanced Risk Management: Understanding chart patterns allows you to set appropriate stop-loss levels and manage risk more effectively. This helps protect your capital and reduce the impact of unfavorable market movements.
- Increased Trading Confidence: Developing proficiency in technical analysis instills confidence in your trading decisions. You can trade with conviction, knowing that your choices are backed by sound analysis and historical patterns.
- Expanded Trading Opportunities: Stock chart patterns can be applied across various markets and timeframes, providing a wide range of trading opportunities. Whether you’re a day trader or a long-term investor, these patterns can be adapted to suit your preferred trading style.
By learning stock chart patterns, you can unlock a world of opportunities and gain a competitive edge in the stock market.
Frequently Asked Questions
What are stock chart patterns?
Stock chart patterns are graphical representations of price movements over time. They provide visual cues about potential reversals or continuations in the market and help traders make informed trading decisions.
Why are stock chart patterns important?
Stock chart patterns are important because they offer valuable insights into market trends and can help predict future price movements. By understanding these patterns, traders can identify potential entry and exit points, manage risk, and improve their overall trading performance.
How can I learn to identify stock chart patterns?
To learn to identify stock chart patterns, it’s crucial to study educational resources, books, and reputable websites that provide information on technical analysis. Practice analyzing historical price charts and use charting software or online platforms that offer pattern recognition features.
Can stock chart patterns guarantee profitable trades?
While stock chart patterns can provide valuable insights, they do not guarantee profitable trades. It’s important to use additional technical indicators, fundamental analysis, and risk management techniques to make well-informed trading decisions.
Are stock chart patterns applicable to all markets?
Yes, stock chart patterns can be applied to various markets, including stocks, commodities, currencies, and indices. The principles of technical analysis and chart patterns remain the same across different markets.
Is it necessary to use stock chart patterns in trading?
While it’s not mandatory to use stock chart patterns in trading, they can significantly enhance your decision-making process. Stock chart patterns provide visual representations of market dynamics, allowing you to make more informed trading decisions.
Learning stock chart patterns is an essential skill for any trader or investor looking to navigate the dynamic world of the stock market. By understanding these patterns, you can gain valuable insights into market trends, identify potential entry and exit points, and improve your overall trading performance. Remember to combine the study of stock chart patterns with other technical indicators, risk management techniques, and fundamental analysis for a comprehensive approach to trading success. Start your journey today, and unlock the potential of technical analysis in your trading endeavors.