Illustration of a stock chart with the bump and run pattern.

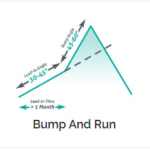
The Bump and Run Pattern

Welcome to this comprehensive guide on the bump and run pattern as it relates to the stock market. In this article, we will delve into the intricacies of this chart pattern and explore its significance for traders and investors. The bump and run pattern is a technical analysis tool that can help identify potential buying […]

Read More   
A price chart showing an example of descending triangle trading.

Descending Triangle Trading: Profitable Strategies

In the world of financial markets, trading patterns can provide valuable insights into potential price movements. One such pattern that traders often analyze is the descending triangle. This article delves into the concept of descending triangle trading, exploring its characteristics, strategies, and potential profitability. Whether you are a novice trader or an experienced investor, understanding […]

Read More   
Double bottom chart pattern illustration.

Double Bottom Chart Pattern: Trading Strategies

Welcome to our comprehensive guide on the double bottom chart pattern, an essential tool for technical analysis in the world of trading and investing. In this article, we will explore the intricacies of this pattern, its significance, and how you can leverage it to identify potential trade opportunities. Whether you are a seasoned trader or […]

Read More   
Example of a cup with handle pattern

Cup with Handle Pattern: Reliable Indicator Trading

Welcome to this comprehensive guide on the cup with handle pattern, an essential tool for technical analysis in stock trading. In this article, we will explore the cup with handle pattern in detail, discussing its definition, characteristics, interpretation, and practical applications. Whether you are a beginner or an experienced trader, understanding this pattern can greatly […]

Read More   

Double Top Chart Pattern: Identifying and Trading

When it comes to technical analysis in the world of trading, chart patterns play a crucial role in predicting future price movements. One such pattern that has gained significant attention among traders is the double top chart pattern. In this comprehensive guide, we will delve into the intricacies of the double top chart pattern, exploring […]

Read More   
Flag chart pattern illustration showing a flagpole and a flag shape, representing a consolidation phase in price movement.

The Flag Chart Pattern: Guide for Traders

Welcome to our comprehensive guide on this pattern, a powerful tool used by traders to analyze and predict price movements in financial markets. In this article, we will delve deep into the concept of this pattern, exploring its definition, characteristics, identification techniques, and trading strategies. Whether you are a beginner or an experienced trader, this […]

Read More   
Showing a falling wedge chart pattern in an uptrend with converging trend lines.

Falling Wedge Chart Pattern

In the fast-paced world of trading and investing, understanding market patterns and trends is key to success. One such pattern that has captured the attention of traders and analysts is the falling wedge chart pattern. This article aims to provide a comprehensive guide to this chart pattern, covering its definition, formation, identification, and potential trading […]

Read More   
A pennant chart pattern formation showing convergence of trendlines and consolidation before a breakout.

Pennant Chart Pattern: A Guide for Traders

Welcome to this comprehensive guide on the pennant chart pattern, a popular and powerful technical analysis tool used by traders. In this article, we will dive deep into understanding the intricacies of the pennant chart pattern, its formation, interpretation, and application in trading strategies. Whether you are a novice trader or an experienced professional, this […]

Read More   
Image depicting the ascending triangle chart pattern in a stock market graph.

What Is Ascending Triangle Pattern: Unraveling Its Secrets for Successful Trading

In the world of technical analysis, patterns play a crucial role in predicting price movements and identifying potential trading opportunities. One such pattern that has gained significant popularity among traders is the ascending triangle pattern. This article aims to delve into the intricacies of the ascending triangle pattern, exploring its definition, formation, trading strategies, and […]

Read More