Reviewed October 3, 2026 · Chart-pattern education
Learn the shape. Identify the missing evidence. Keep the forecast separate.
Use this library to understand common stock-chart patterns and compare similar formations. The guides explain conventional interpretations, show their limits and link to a shared testing framework.
Start with observed highs and lows, rather than a promised outcome.
A recognizable shape is not a measured trading advantage.
Start with the question, then choose a guide
A pattern is a description of selected price movements. A trading strategy adds decision timing, order rules, sizing, costs and an evaluation method. Keep those two tasks separate: learning to recognize a shape does not demonstrate that trading it produces an advantage.
Test the evidence
Learn to define a pattern, avoid future-information leakage and evaluate results after costs.
Understand continuation
Compare a possible pause with an actual continuation of the preceding trend.
Triangles and wedges
Begin with the two boundaries. Are the highs level, falling or rising? What are the lows doing? That observation is more useful than choosing a bullish or bearish label first.
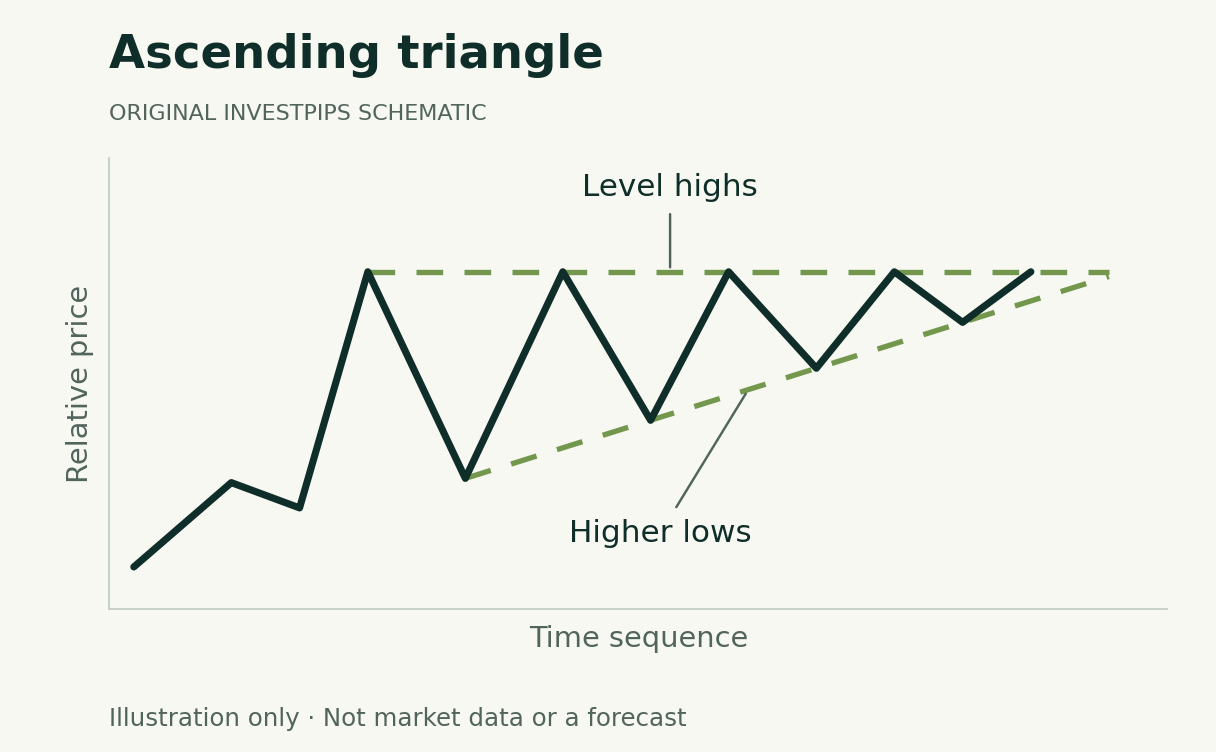
Ascending triangle
A level upper boundary with rising lows. Start here for recognition.
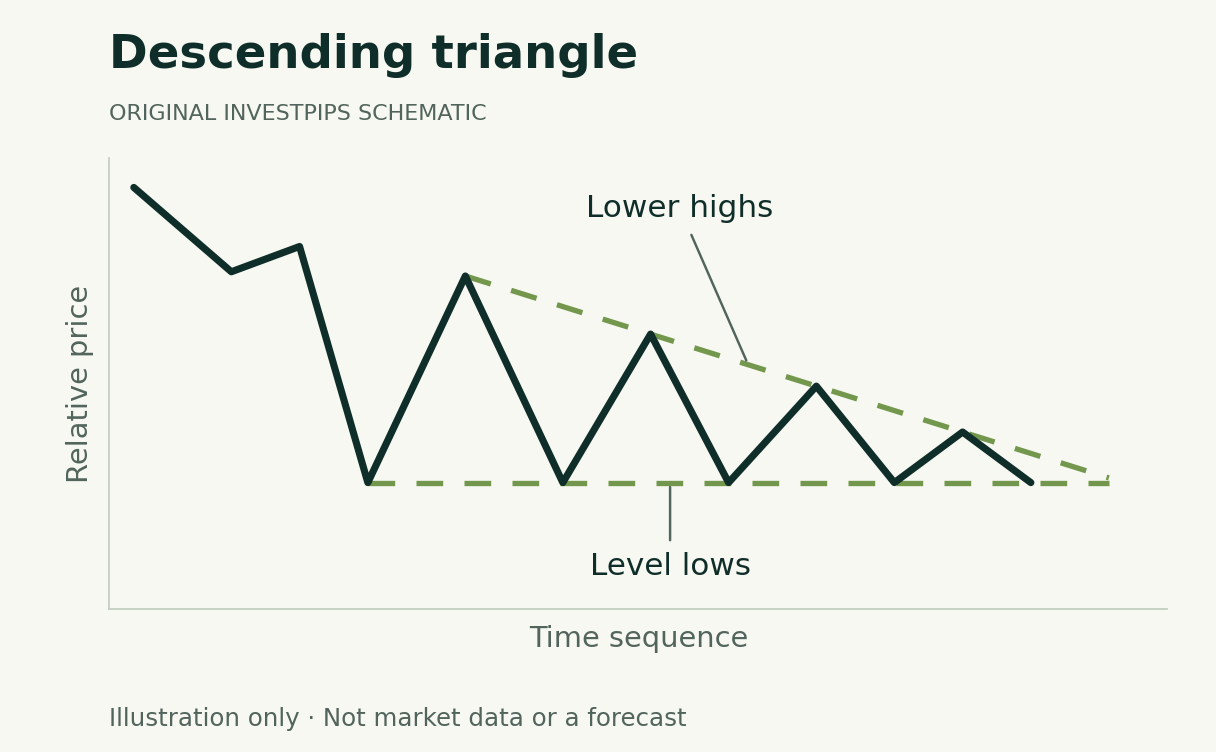
Descending triangle
A level lower boundary with falling highs. Lower highs do not form horizontal support.
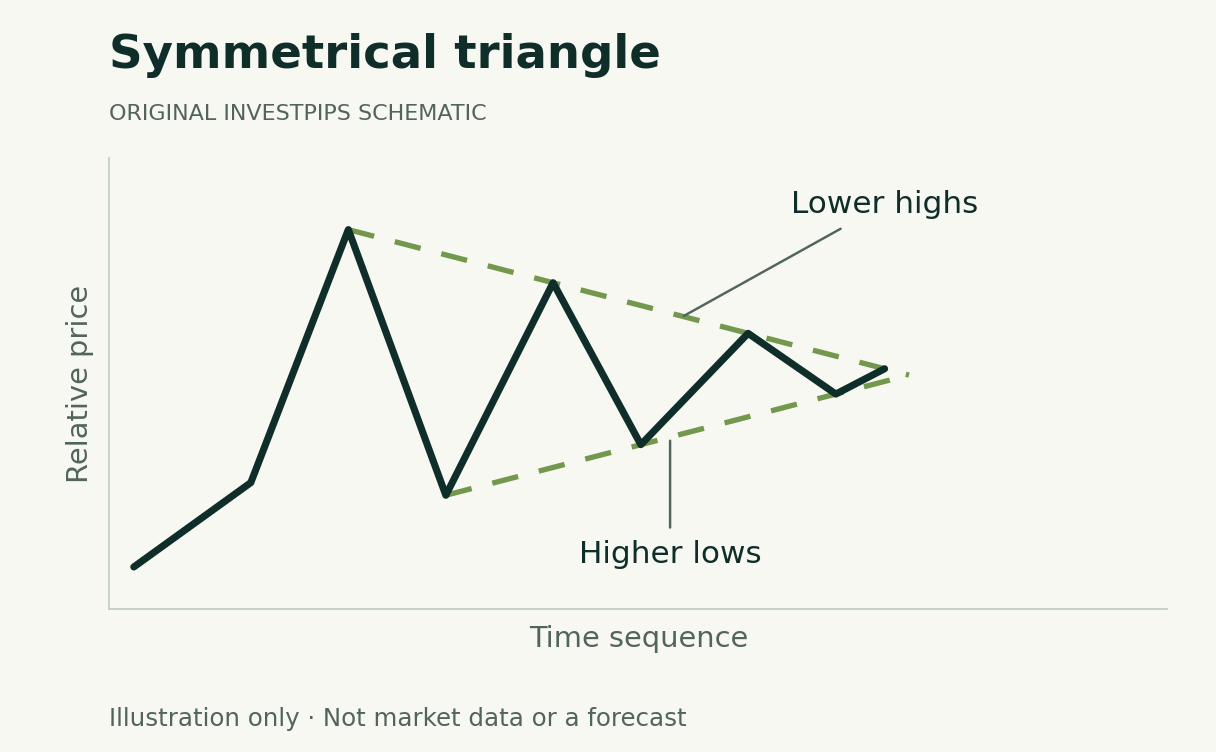
Symmetrical triangle
Lower highs and higher lows converge. The shape alone does not select a breakout direction.
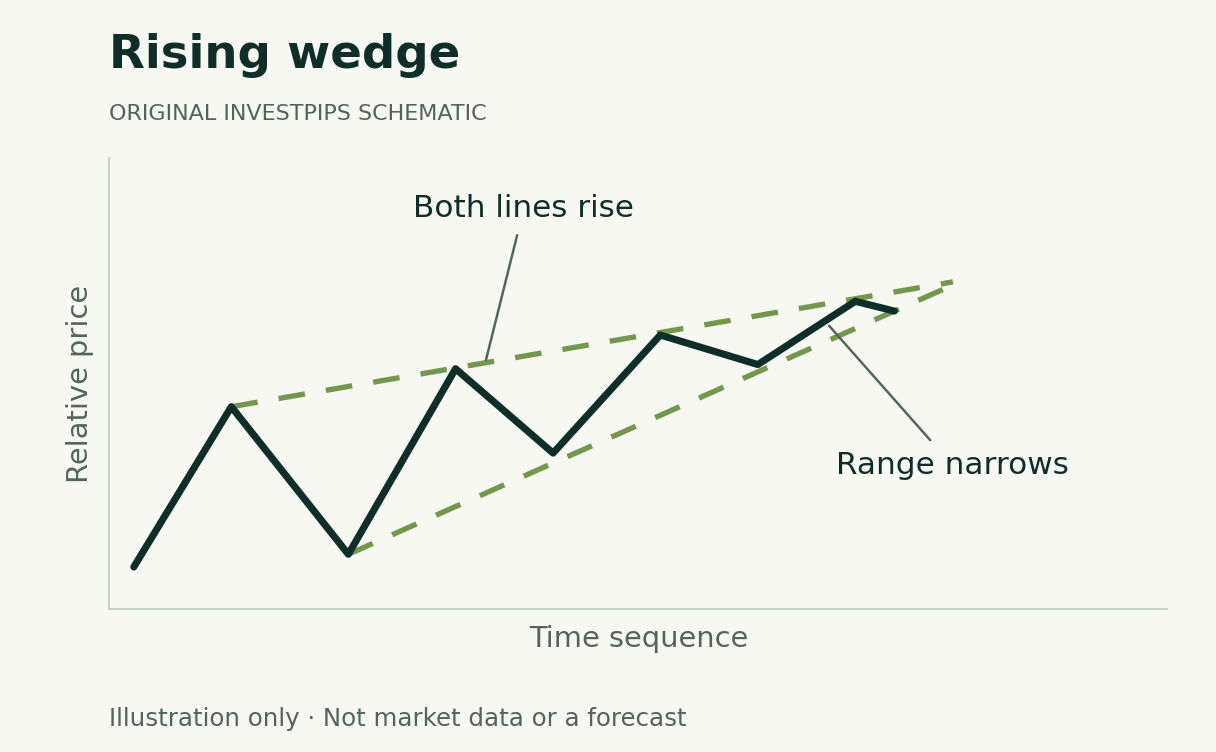
Ascending triangle vs. rising wedge
Compare a flat ceiling with two rising boundaries—and the different conventional interpretations.
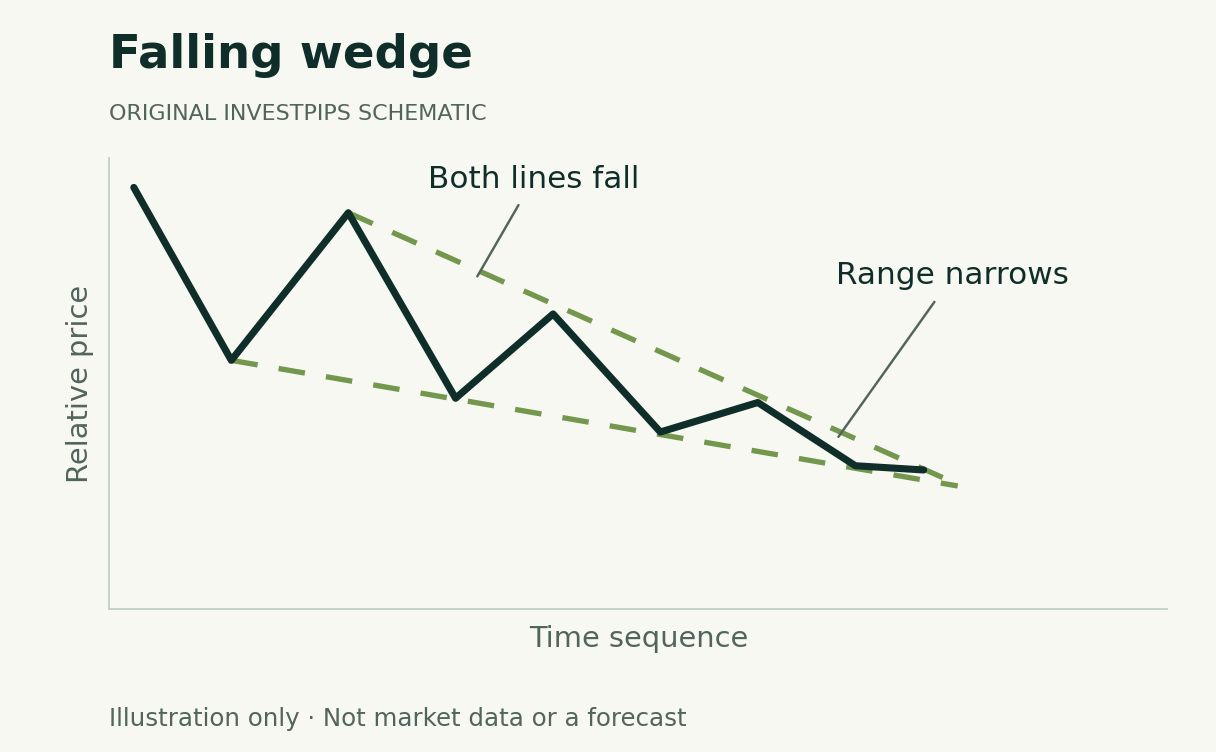
Falling wedge
Two descending boundaries narrow. The prior trend determines whether a bullish interpretation would be a reversal or continuation.
Ready to work with numbers? The ascending-triangle worked example separates the pattern height, an assumed entry, a projected objective and planned loss exposure.
Tops, bottoms and a reversal after acceleration
Two or three similar turning points are only a candidate formation. The relevant intervening level and preceding trend give that shape its context. These guides cover ordinary price charts; similarly named point-and-figure signals use different rules.
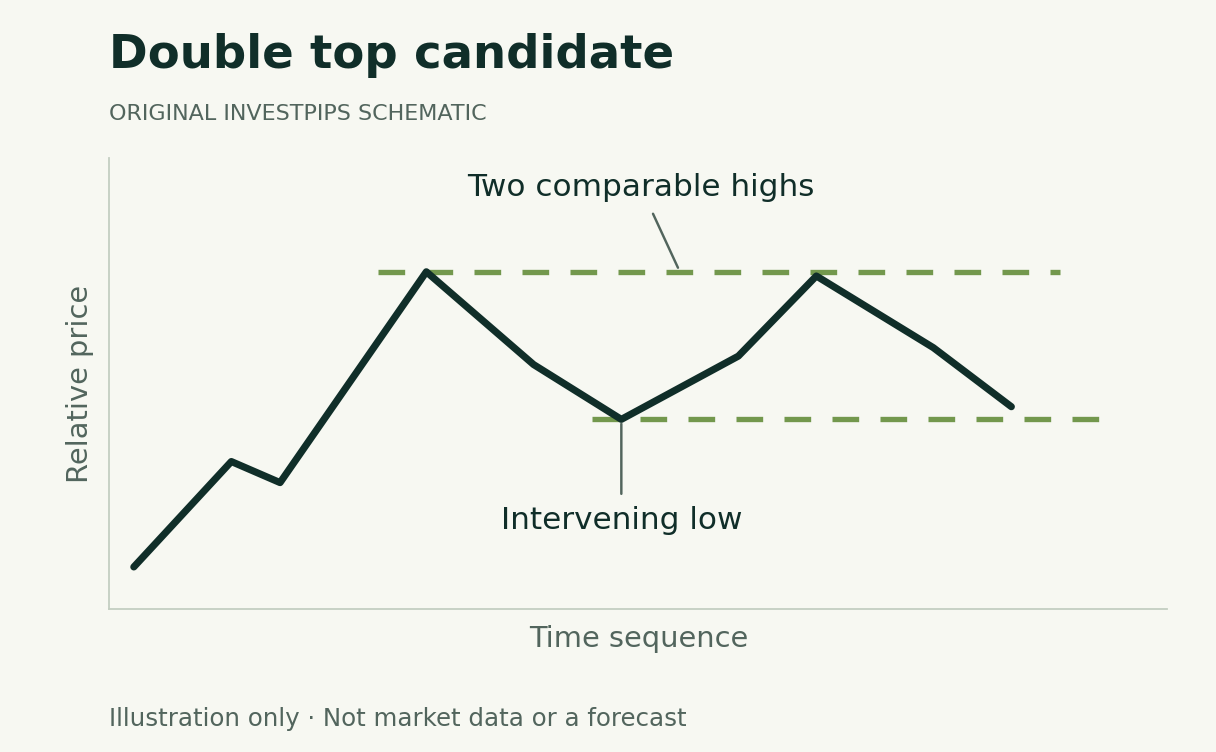
Double top
Two comparable highs after an advance, with attention on the intervening low.
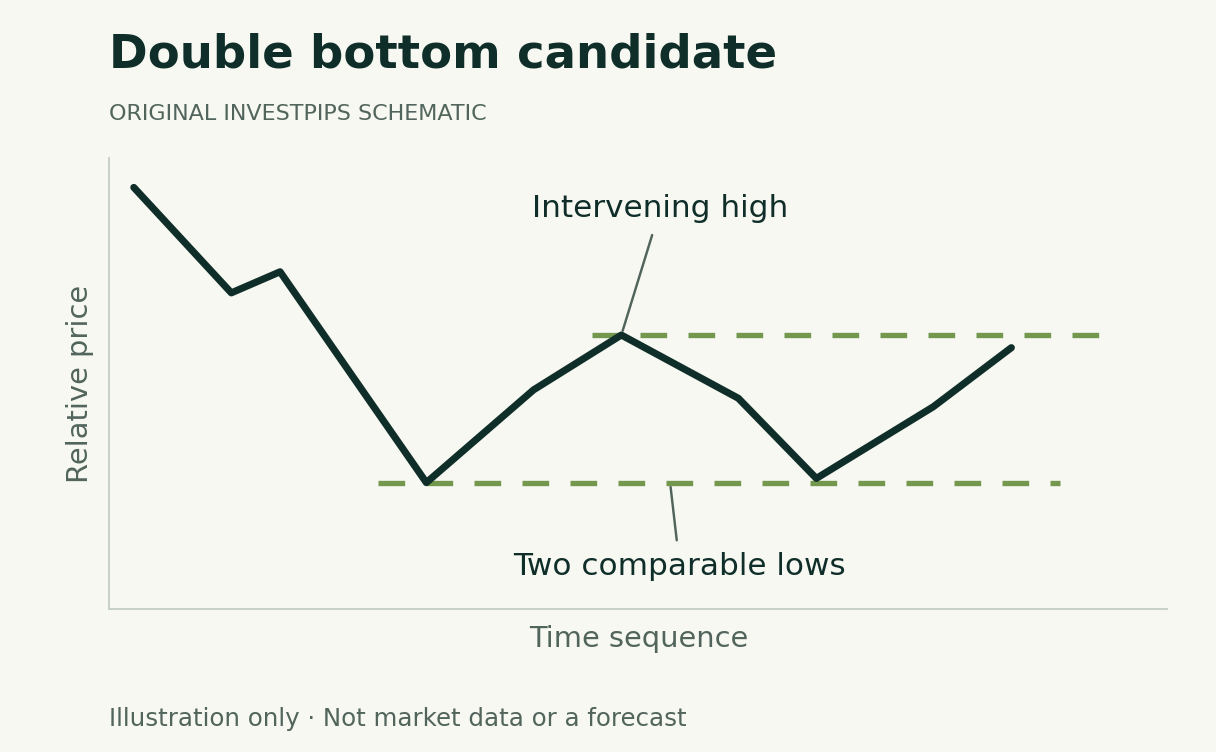
Double bottom
Two comparable lows after a decline, with attention on the rebound between them.
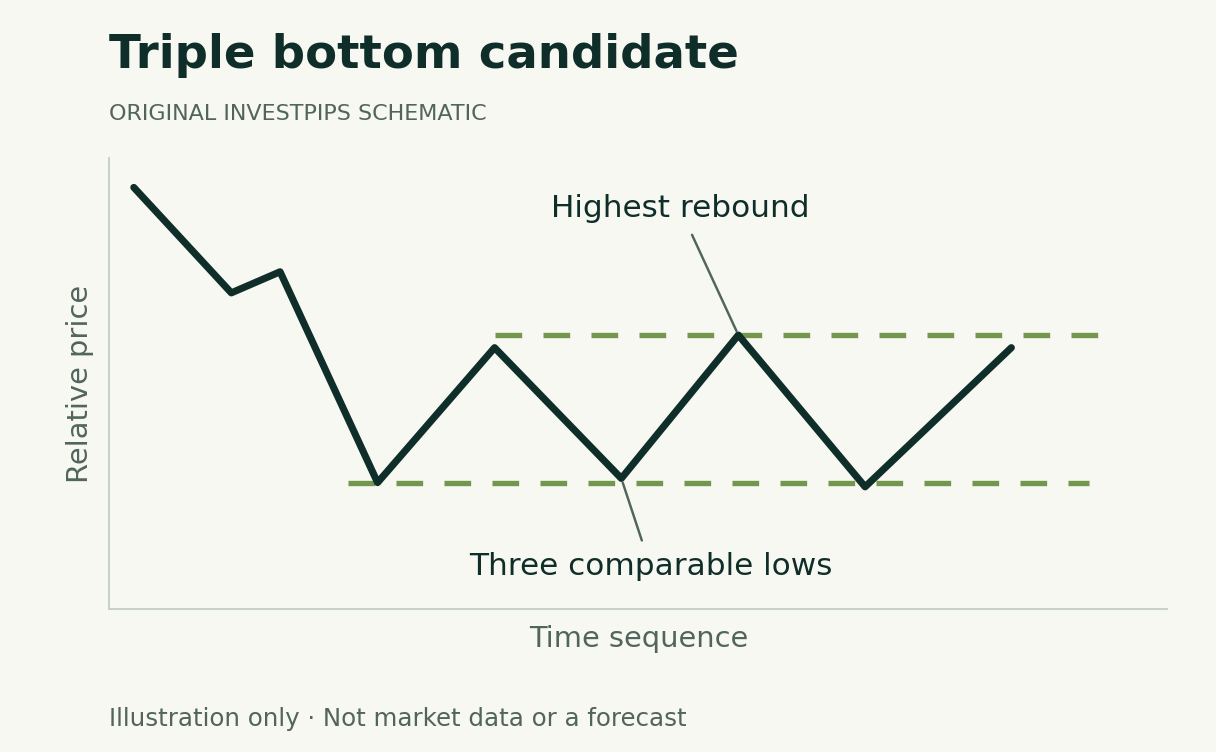
Triple bottom
Three separated lows; the highest intervening rebound sets the reference resistance.
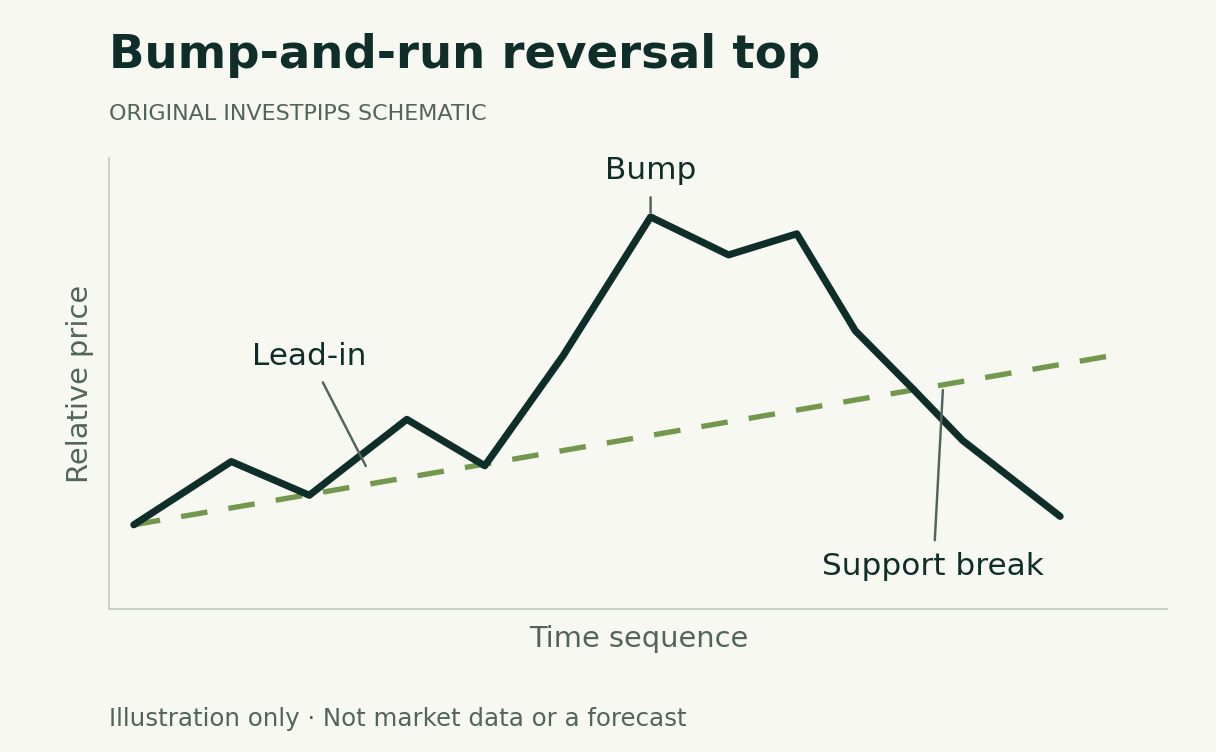
Bump-and-run reversal
An orderly advance, a steeper acceleration and a break of the original trendline. The top version ends with a decline.
Flags, pennants and the cup with handle
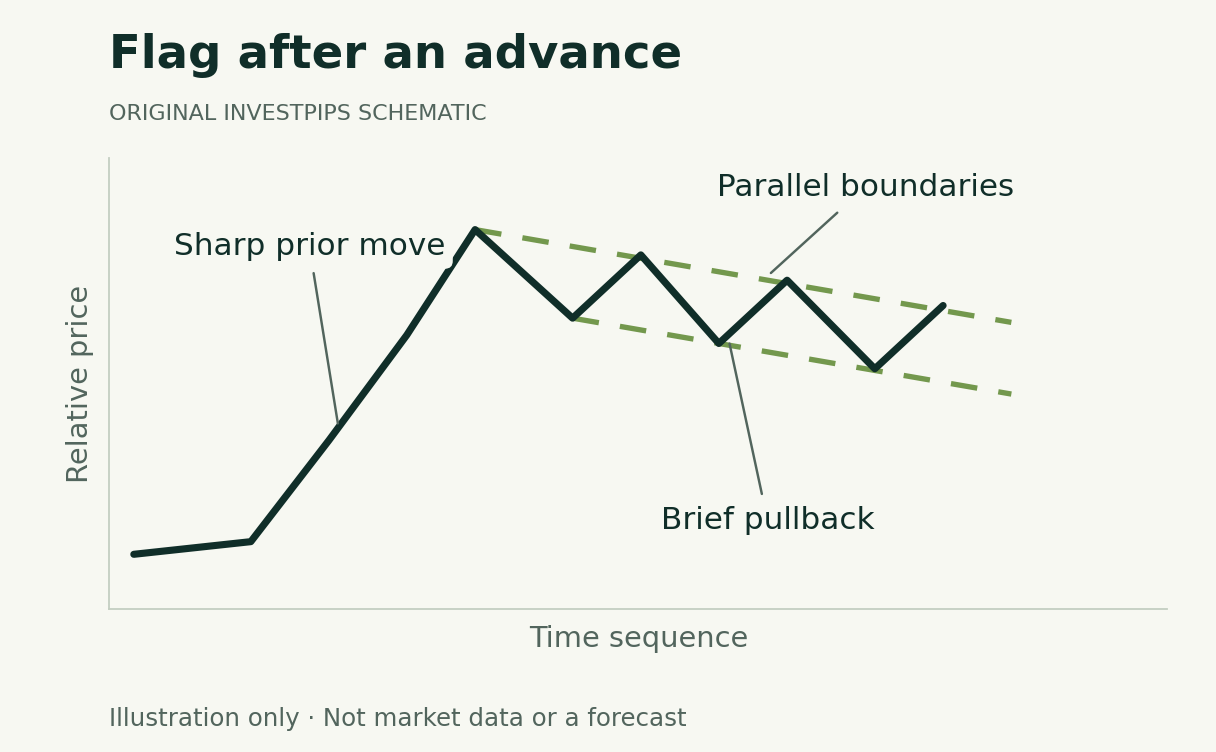
Flag
A sharp move followed by a brief, roughly parallel consolidation.
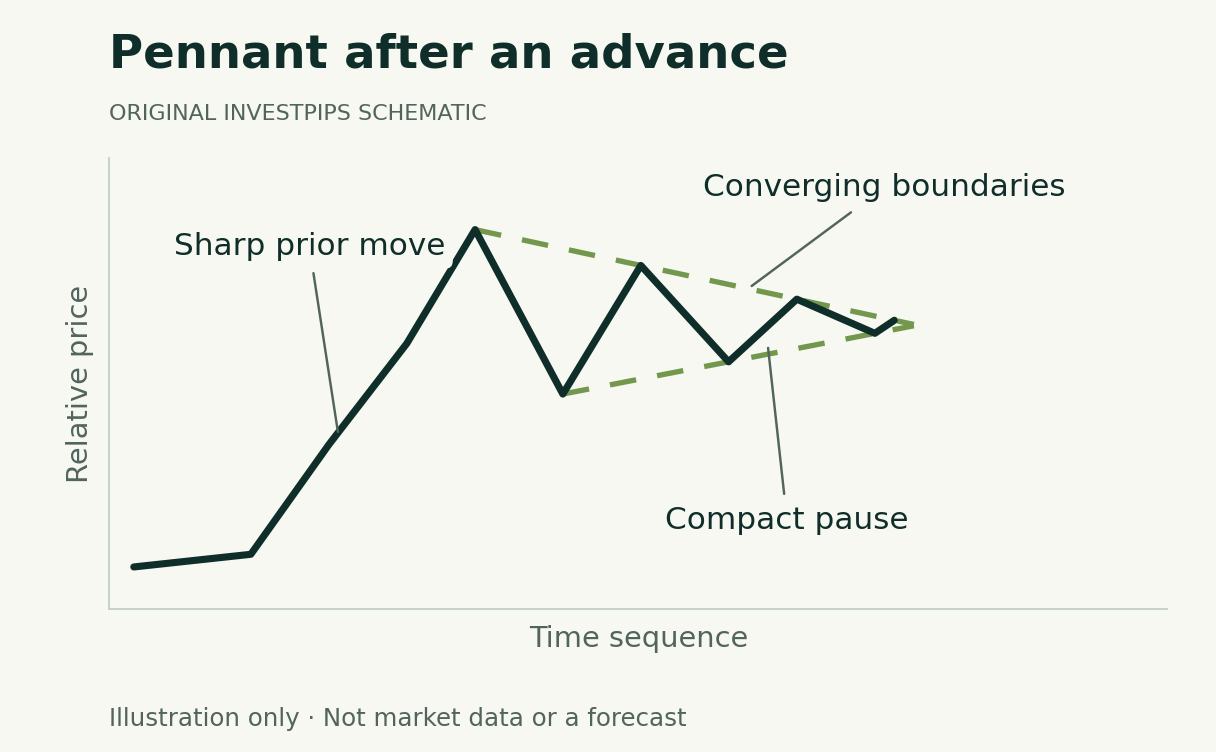
Pennant
A sharp move followed by a compact pause with converging boundaries.
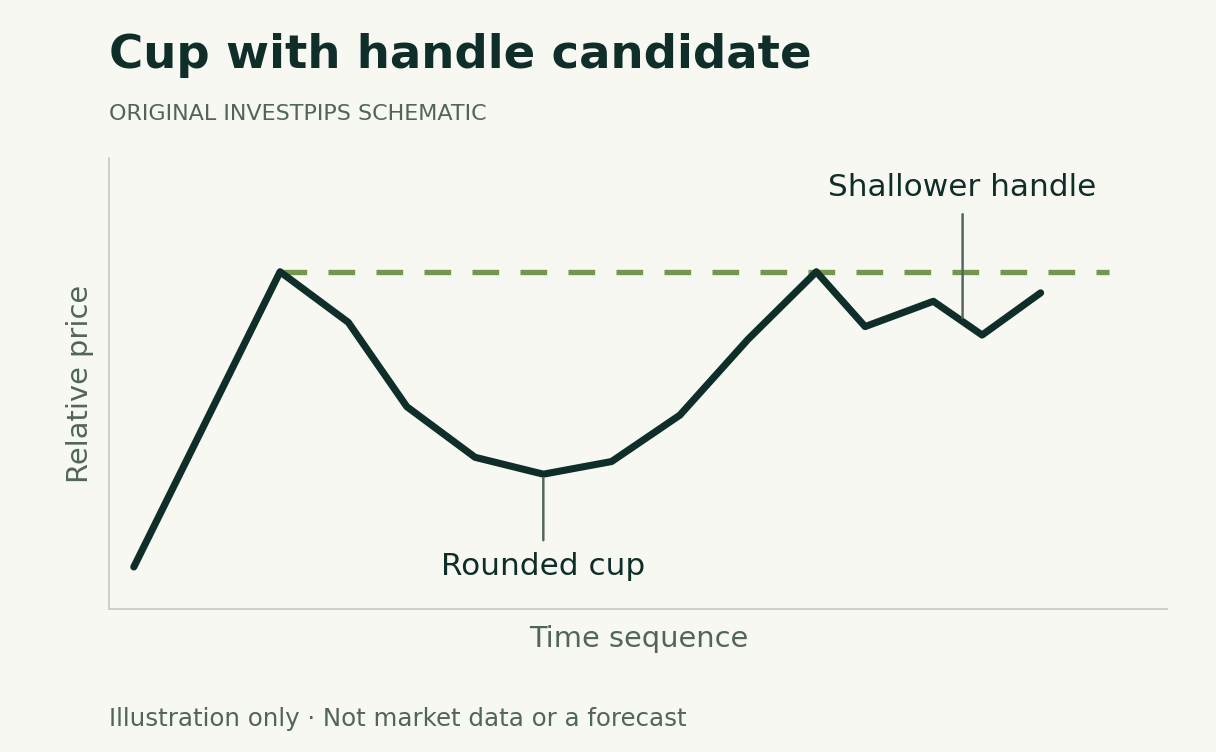
Cup with handle
A rounded base and a shallower pullback near the right-hand rim.
A consistent way to read every diagram
Scroll across the table to see all columns.
| Question | What to record |
|---|---|
| What came before? | The preceding trend, instrument and chart interval. |
| Which points define the shape? | The specific highs and lows, price input and chart scale. |
| What completes the definition? | A stated crossing or closing rule, rather than a visual impression. |
| What remains unknown? | The next price, achievable execution and profitability. |
Every diagram here uses invented prices and a simplified time sequence. Dashed lines show selected reference boundaries. Most stop at a candidate formation, before any breakout; the captions state exceptions. They are teaching illustrations, not historical examples chosen because they worked.
Support and resistance are reference areas, not physical floors or ceilings. A breakout can reverse. A larger volume bar can be an observation worth recording, but it is not a guarantee. Do not infer the identity or intention of traders from the shape alone.
Use a learning path
Read one pattern guide, write down its exact definition, then examine examples without revealing the next prices. Keep ambiguous and failed cases in the record. The testing guide explains how to turn that exercise into a reproducible study.
Continue learning
Study the research framework · Compare continuation patterns
Sources and method
Substantively reviewed October 3, 2026. Diagrams and numerical examples are original, synthetic teaching material. They do not reproduce a security’s trading history, a backtest or a validated strategy. Pattern names describe charting conventions; this article assigns no success probability.
Primary references: StockCharts pattern classifications and limitations.
Advertising is separate from this guide. Read our editorial and advertising standards.
What changed in this update
Replaced the old image gallery, incomplete image links and repetitive introductory material with a connected learning library. Corrected the double-bottom description and removed unsupported reliability and performance claims. The original URL and publication date are preserved.
Educational information, not personalized investment advice or a recommendation to trade. A diagram or measured-move projection does not guarantee an outcome.